Running an Amazon store may seem straightforward, but staying in stock is one of the toughest challenges sellers face. Many Amazon sellers lose money and sales due to poor inventory planning. If you run out of stock, you not only lose sales but also damage your product rankings. That is why Amazon demand forecasting is essential for long-term success.
I have managed inventory forecasting for Amazon sellers across a wide range of categories, and the sellers who get this right are rarely the ones with the fanciest software. They are the ones who understand what the data is actually telling them. In this blog, I will show you how to accurately forecast demand, avoid costly stockouts, and maximise sales on Amazon. Follow each proven step to stay ahead of customer demand and grow your store profitably.
Understand the Basics of Demand Forecasting
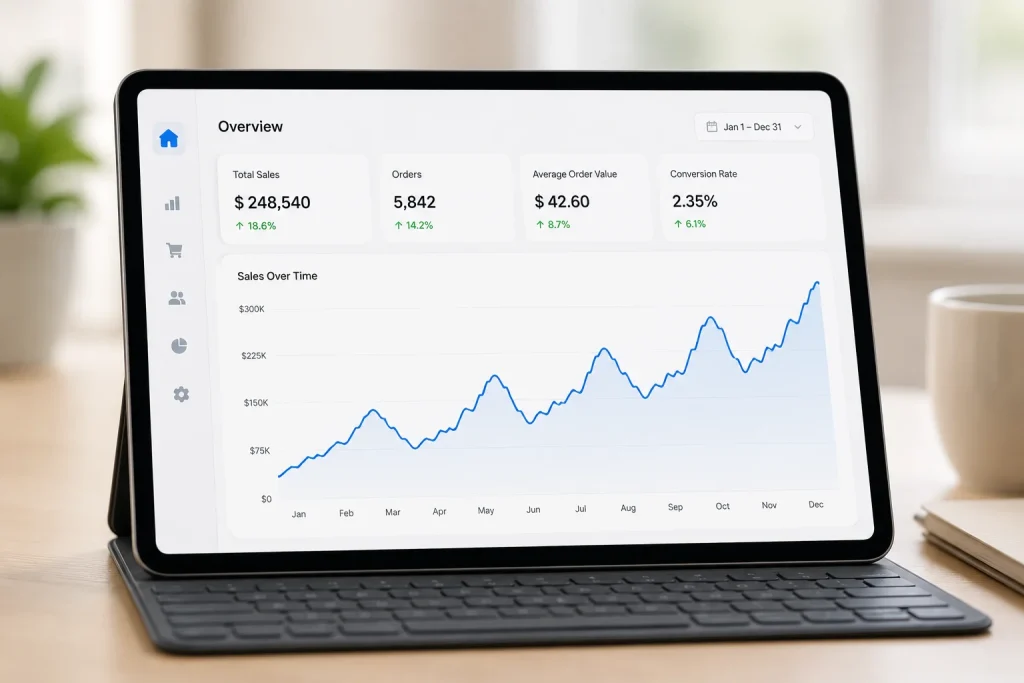
Demand forecasting means predicting how much stock you will need. It helps you avoid overstocking or running out. Forecasting works best when you use both data and experience. When you know what to expect, you make smarter decisions.
You need to understand your products well. Some products sell more during holidays. Others move fast in summer or winter. You also need to check your past sales. Look at trends over the past year. Did sales go up in November? Did they drop in February? This helps you plan better.
Always look at what changed. A price drop may have caused a spike in sales. A competitor may have run out of stock. Keep these things in mind when you look at the numbers.
Use these lessons to guide your next forecast. In my own client work, the forecasts that go wrong almost always trace back to someone ignoring a change like this rather than the model itself being bad.
Amazon Inventory Forecasting vs Demand Forecasting: What Is the Difference?
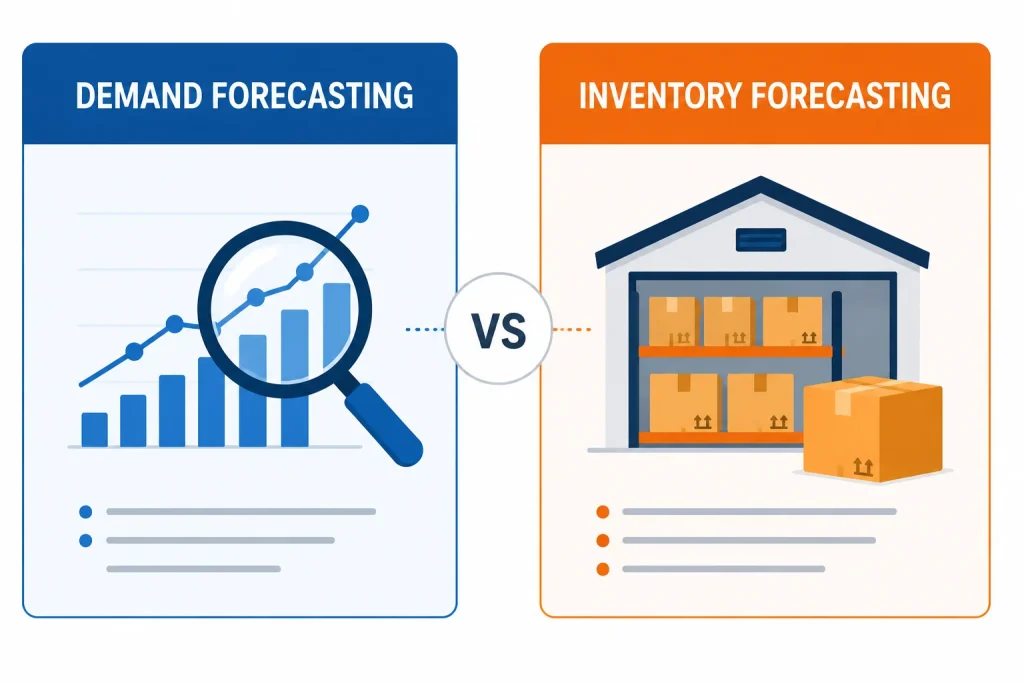
Sellers often use these two terms interchangeably, and in practice they overlap quite a bit, but I think it is worth separating them clearly because Amazon’s own tools treat them slightly differently.
Demand forecasting is about predicting future customer demand, meaning how many units buyers are likely to want in a given period. Amazon inventory forecasting is more about planning how much physical stock you need on hand and when to meet that demand without tying up too much cash or warehouse space.
Amazon’s Inventory Performance Dashboard is where inventory forecasting becomes practical. It tracks your IPI score, which reflects how efficiently you manage stock levels, sell-through rate, and excess inventory. I always tell clients to treat their IPI score as a health check, not a target to chase for its own sake. A high IPI score with poor demand forecasting underneath it still leads to stockouts; the two need to work together.
When I onboard a new client, one of the first things I do is pull their inventory forecasting data alongside their raw demand numbers, because looking at either one alone gives an incomplete picture.
Use Amazon’s Tools for Forecasting
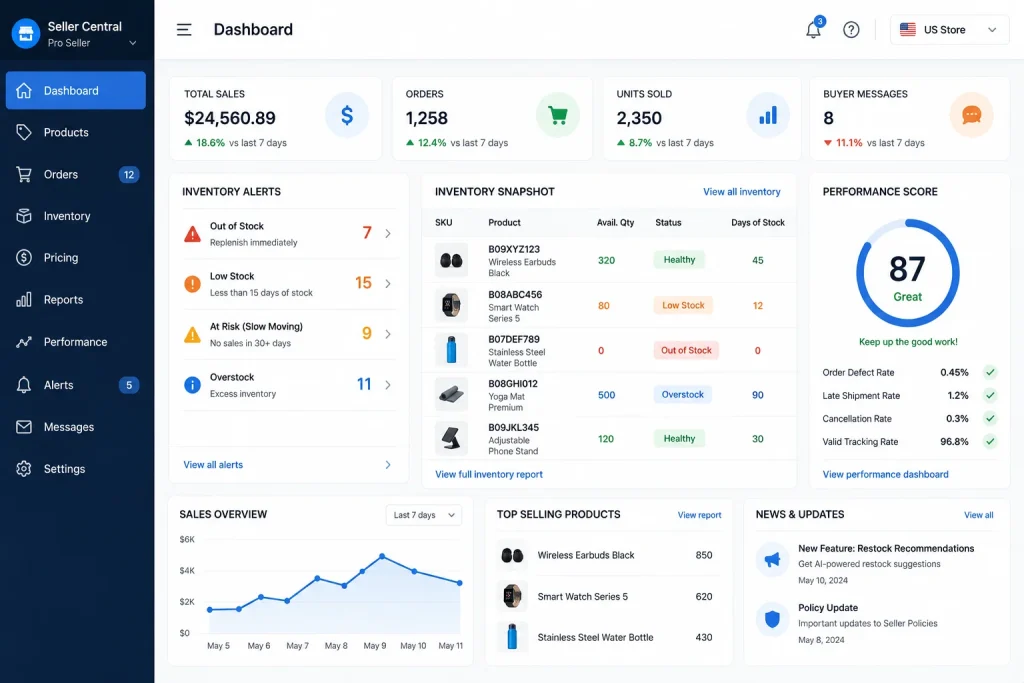
Amazon gives sellers a few tools to help with planning. These tools use real sales data. They show trends and suggest how much stock you may need. Many sellers do not use them. You should take full advantage. The Amazon Selling Coach gives you inventory alerts. It warns you when stock is low. It also suggests how much to restock. The Inventory Performance Dashboard shows how well you manage stock. Keep your IPI score high to avoid limits.
Amazon’s demand forecast report uses past trends to help plan. You can view sales patterns, seasonality, and peak periods directly inside this report. I pull this exact report for every client at the start of each quarter, and I cross-reference it against their own sales history rather than trusting it in isolation, since the report works best as a starting point rather than a final answer. Always check your demand forecast report weekly. Stay ahead of the curve and take quick action.
Amazon Sales Forecasting and How It Fits Into Your Bigger Strategy
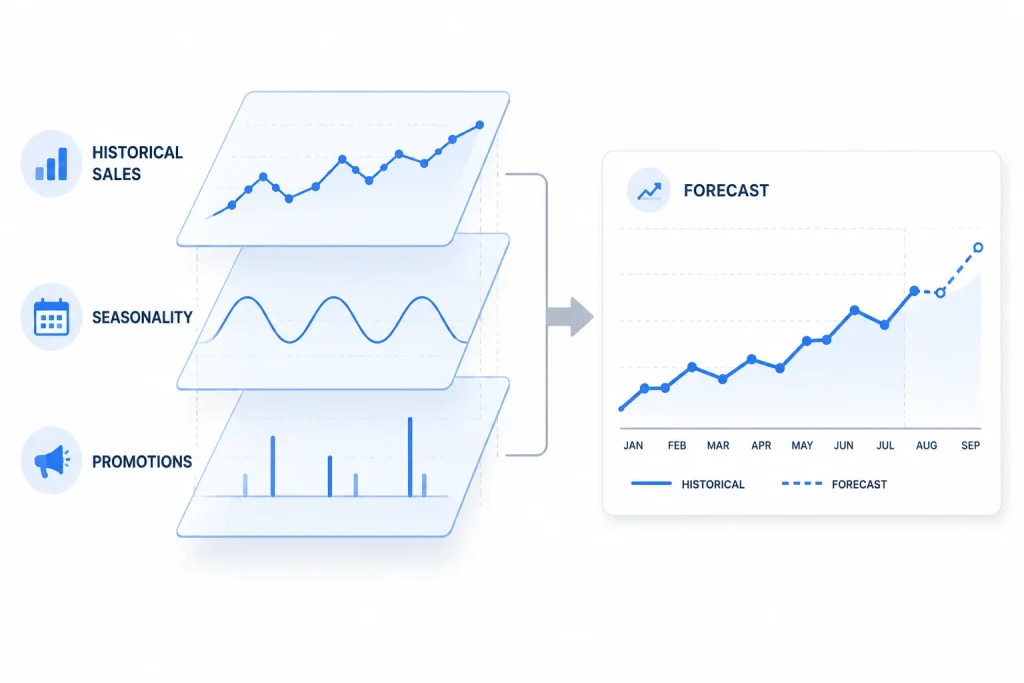
Sales forecasting and demand forecasting are closely related, but I find it useful to think of sales forecasting as demand forecasting applied specifically to your revenue and unit sales targets rather than just stock levels. When I build a sales forecast for a client, I start with their historical unit sales, then layer in planned promotions, expected seasonality, and any changes to advertising spend. This gives a clearer picture than Amazon’s demand forecast report alone, because Amazon’s report cannot know about a promotion you are planning to launch next month. A good sales forecast tells you not just how much stock to order, but when your revenue is likely to rise or dip, so you can plan cash flow and ad budgets around it, not just warehouse space. I recommend rebuilding your sales forecast every four to six weeks, since stale forecasts are often worse than no forecast at all.
Analyse Historical Sales Data in Detail
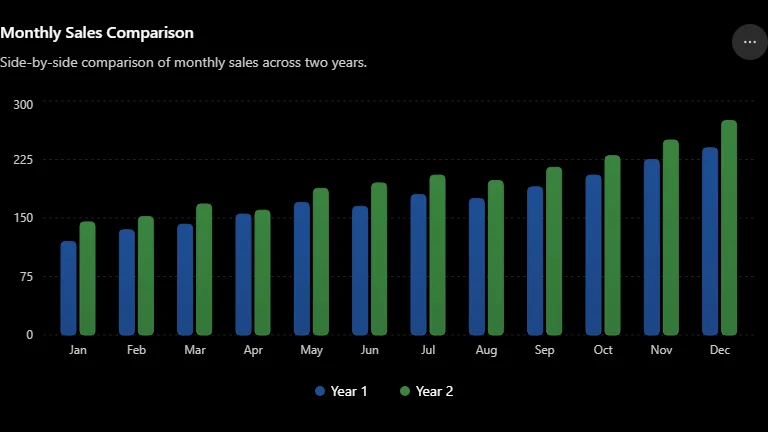
You need to study your past sales. This tells you what may happen in the future. Start by choosing a time range. A full year works best. This shows all trends, including high and low seasons. Shorter time ranges may give false hopes. Look at your daily and weekly sales. Did they increase in a pattern? Check which days get the most orders. Weekends often show high activity. Also, note product returns. High returns may mean you must restock less.
Now break the data into parts. Compare this year to last year. Did you sell more units? Were the profits higher? Look for gaps. If one month had low sales, ask why. Did your ad stop running? Did a review hurt your product? Use the answers to shape your forecast. I have caught more than one client’s forecasting error simply by asking why a single month looked off, rather than trusting the trend line.
Track External Factors That Affect Demand

External factors change demand fast. You cannot control them, but you can track them. Always stay alert. This helps you react in time and avoid stockouts. Weather is a big factor. For example, rainwear sells fast in wet months. If a storm is coming, demand may spike. Trends also affect sales. A viral video can make a product sell out in days. You must act fast when trends appear. Holidays and events change shopping habits. Prime Day, Black Friday, and Christmas see massive spikes. Plan early. Order extra stock one or two months ahead. Also, follow the news. A supply chain delay in another country can impact your stock. Always have backup plans.
Create a Clear Inventory Replenishment Plan
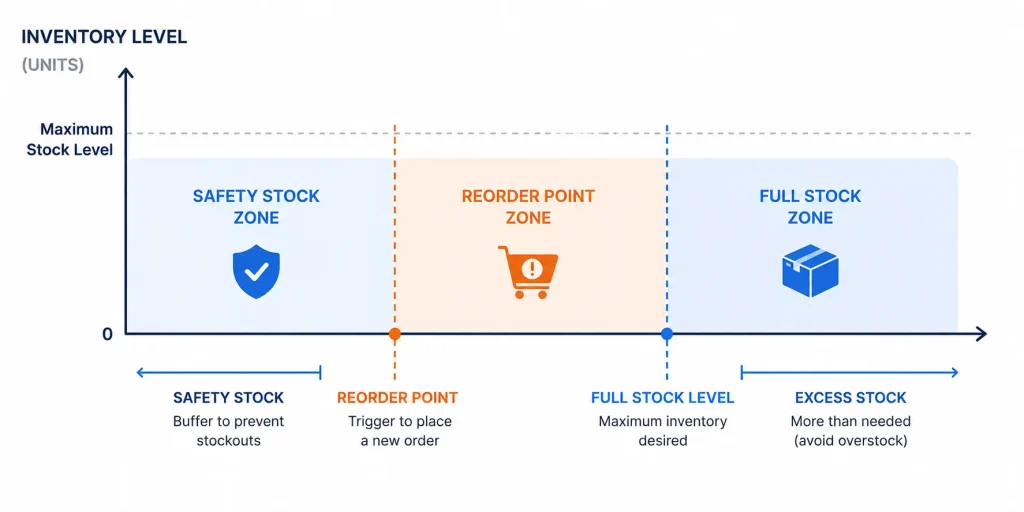
A good replenishment plan helps avoid running out of stock. You must know when to reorder and how much to order. This plan keeps your shelves full and your sales steady. Start by setting a reorder point. This is the number of units left before you place a new order. To set this, you must know your daily sales rate and your supplier’s lead time. For example, if you sell 10 units a day and your supplier takes 10 days to deliver, you must reorder when 100 units are left.
Next, use safety stock. This is extra stock to cover delays or demand spikes. Let us say your usual sales are 10 units a day. During a sale, you may sell 15. If your supplier delays a shipment, this buffer saves you. A safety stock of 50 to 100 units is smart for most sellers, though I adjust this range higher for clients with unpredictable suppliers or long international lead times. Lastly, track shipments. Use tracking tools. Get alerts when a shipment is delayed. If you know early, you can adjust ads or set limits on orders. Always stay in control.
Use Inventory Management Software
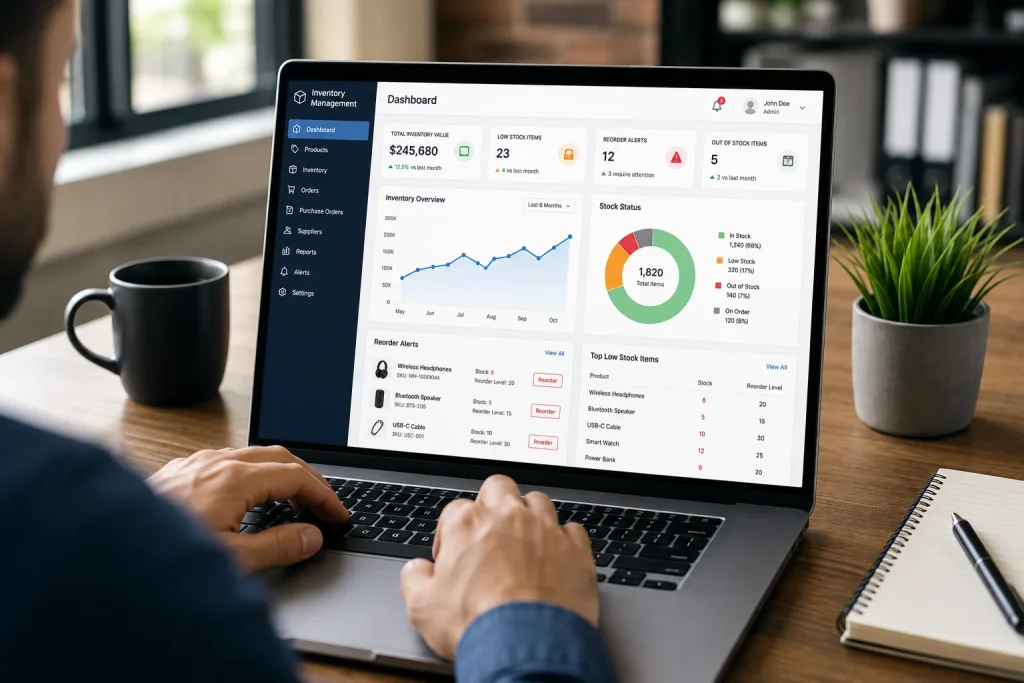
Managing stock by hand is risky. You may forget something or make a mistake. Use software to save time and avoid errors. These tools help you stay on track. Inventory software tracks sales and stock in real time. It alerts you when stock is low. It also shows how fast items are selling. You see all the data in one place. This makes it easy to plan and restock.
Some software also connects with suppliers. You can set automatic reorders. When stock reaches the reorder point, the system sends a request. This keeps your store running with no gaps. Popular tools include RestockPro, SoStocked, and Skubana. I have set up all three for different clients, and the right choice usually comes down to how complex your supplier network is, not which tool has the most features.
Monitor Your Top-Selling Products Daily
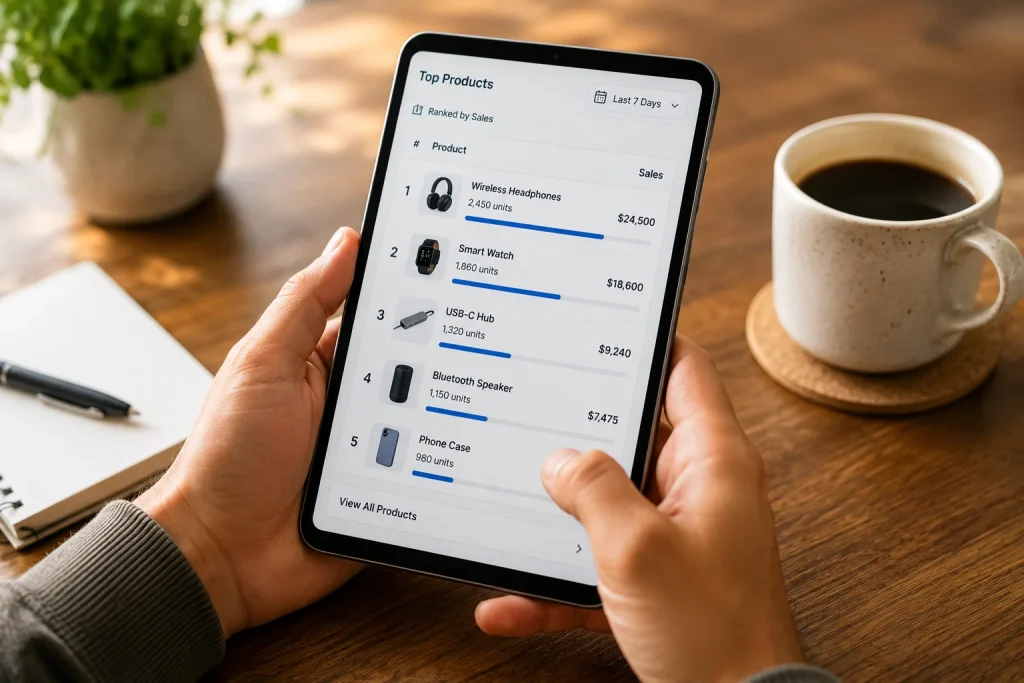
Your top sellers need close attention. These products drive most of your profits. If you run out, you lose money fast. Check them every day. Start your day by checking stock levels. Open your dashboard. Look at the top five or ten products. Did one drop to low stock? Did a sudden spike in orders happen? If yes, take action right away. Contact your supplier. Place an order before it is too late.
Also, look at reviews and ads. A bad review can slow sales. A good ad can speed them up. If sales rise, update your forecast. Add more stock to your plan. This keeps you ahead of any changes.
Watch Lead Time Closely and Plan Around It
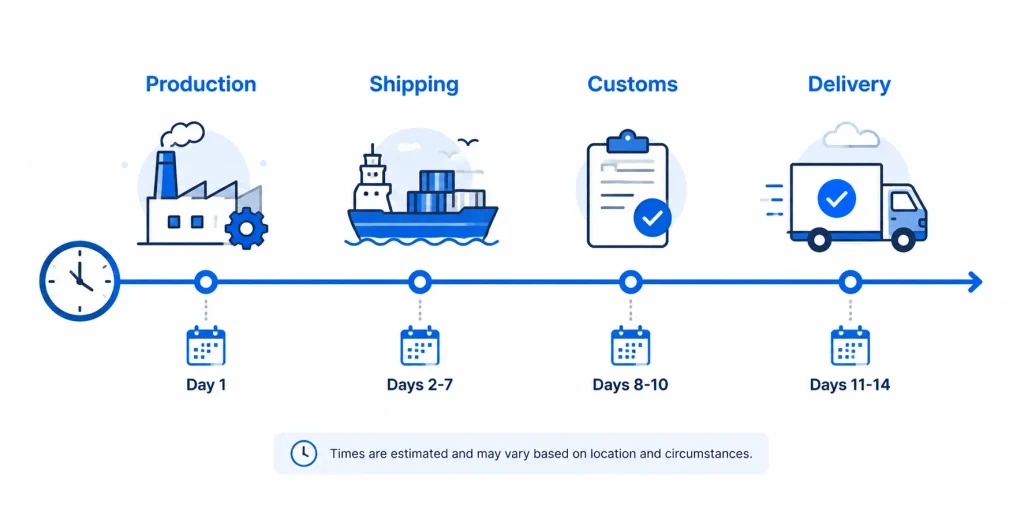
Lead time is the time it takes to receive stock after placing an order. It includes production, shipping, and customs. Long lead times need early planning. Short ones need quick actions.
Make a table to track lead times from each supplier:
| Supplier Name | Product | Lead Time (Days) | Reorder Point (Units) |
| ABC Traders | Phone Cases | 15 | 200 |
| XYZ Imports | Chargers | 10 | 150 |
| FastSource | Cables | 7 | 100 |
Always check for delays. If a supplier usually takes 10 days but now needs 14, update your plan. Do not wait. Add safety stock. Look for faster options if needed. Also, plan for events. Holidays can slow shipping. Chinese New Year can delay products from Asia. Always plan two months in advance. Keep your lead time updated every week.
Use the Power of Seasonality in Forecasting
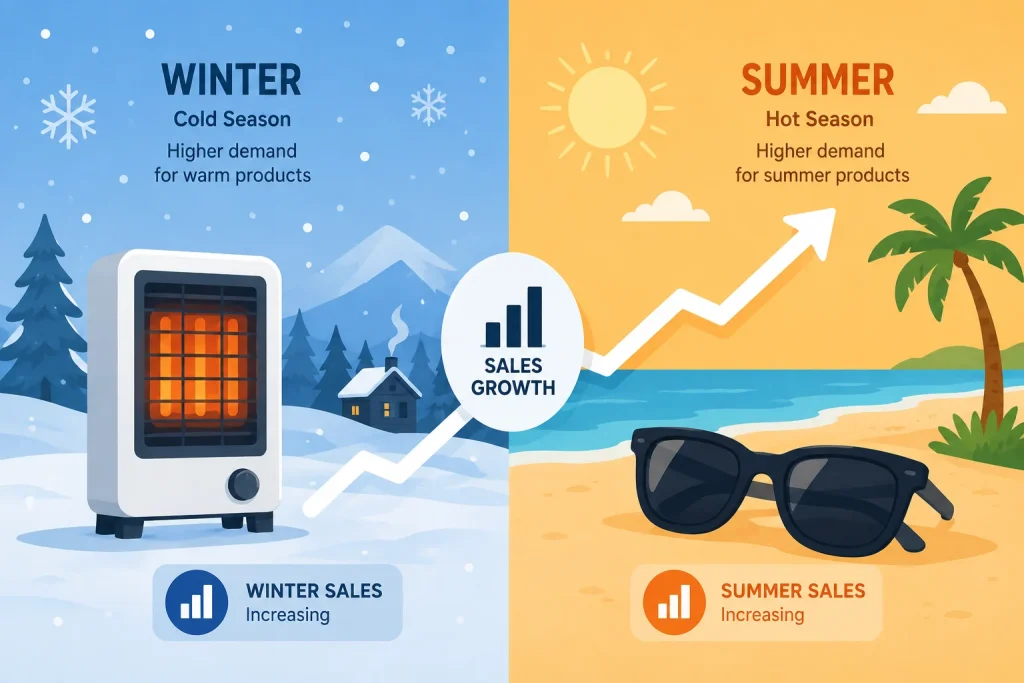
Some products sell more in certain months. This is called seasonality. Ignoring it can lead to stockouts or too much stock. You must plan by the season. For example, heaters sell more in winter. Sunglasses sell more in summer. Use last year’s sales to see the pattern. Check sales per month. Did your sales jump in June? Plan for that this year too. Update your stock plan before the season starts. Do not wait. If sales rise in July, restock in May. This gives time for shipping. Use a calendar and mark sales peaks. Review it monthly and update when needed.
Prevent Stockouts with Smart Actions
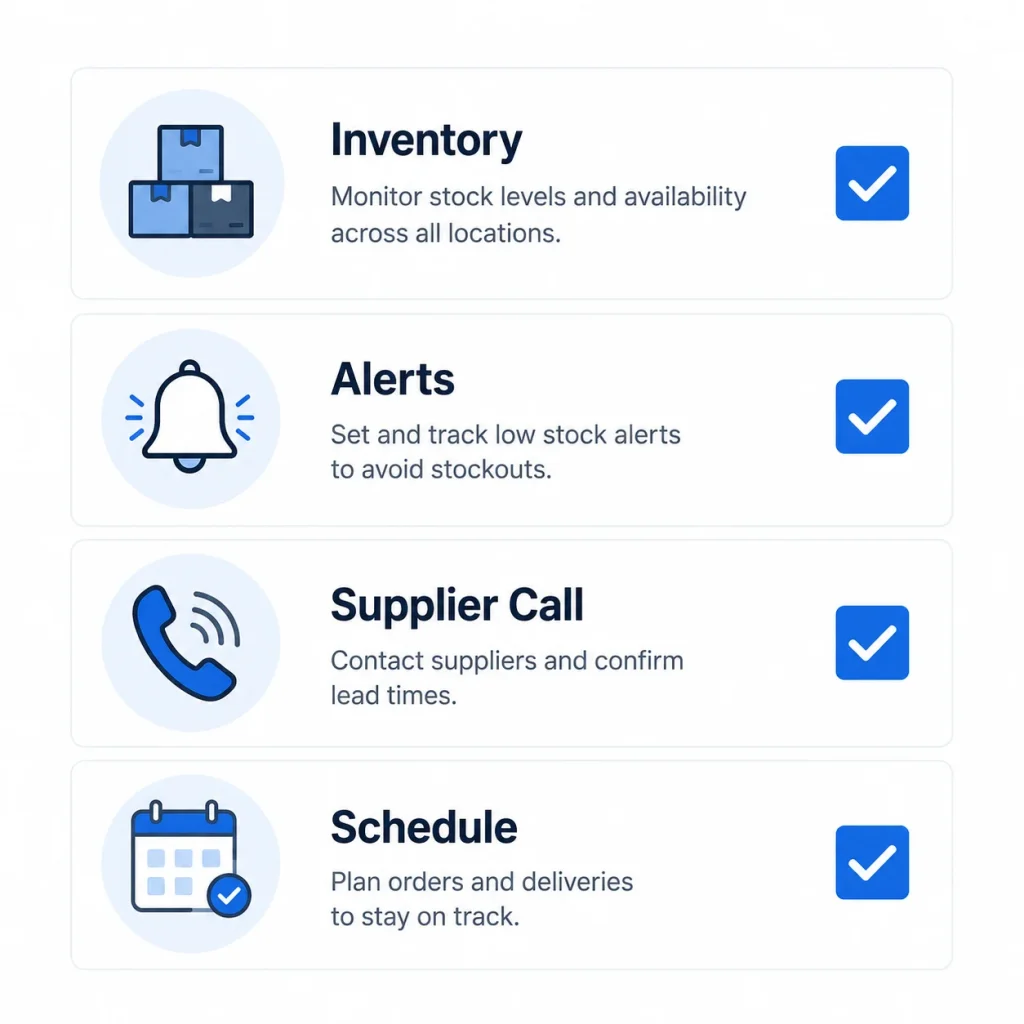
You must act early to avoid stockouts. Small steps make a big difference. Use these tips to stay stocked:
- Check inventory daily.
- Set alerts for low stock.
- Use safety stock always.
- Talk to suppliers weekly.
- Plan for holidays early.
- Use software for tracking.
- Review sales weekly.
- Keep ads in check when stock is low.
These steps may seem small. But they save your store from big losses. Stockouts hurt your sales, ads, and rankings. So, take action before it happens.
Case Studies: Demand Forecasting in Practice
Case Study 1: Fixing a Recurring Stockout Problem
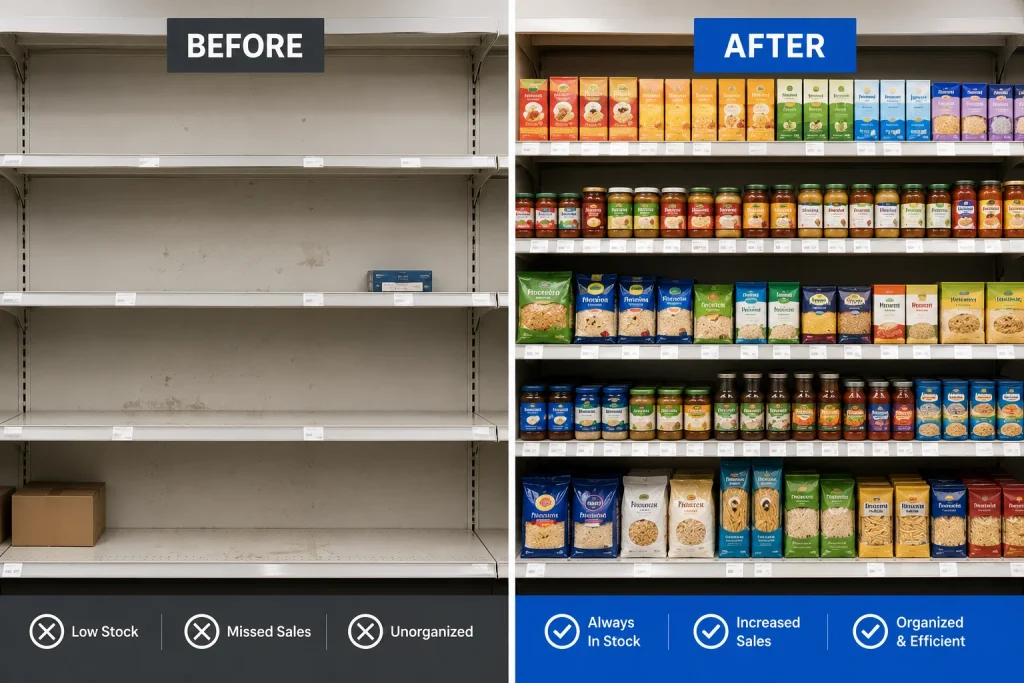
I took on a client selling kitchen accessories who was hitting stockouts on their best seller almost every quarter, right before their busiest sales weeks. Their old process relied entirely on gut feeling and a quick glance at current stock levels. I built a proper reorder point and safety stock system for them, based on their actual daily sales rate and their supplier’s real lead time, not the lead time listed on the supplier’s website, which was consistently shorter than reality. Within two restocking cycles, the recurring stockout disappeared completely, and their sales rank on that product became noticeably more stable since it was no longer crashing every few months.
Case Study 2: Turning Amazon’s Demand Forecast Report Into a Usable Plan
Another client had access to Amazon’s demand forecast report but had never actually acted on it. They were overstocking slow-moving products and running short on fast movers at the same time. I combined their demand forecast report data with their own 90-day sales history to rebuild their reorder points across their full catalogue. Excess inventory dropped noticeably within one quarter, and their IPI score improved enough to remove a storage limit that had been quietly capping their ability to restock their best sellers.
Frequently Asked Questions About Amazon Demand Forecasting
Amazon forecasts demand using your historical sales velocity, seasonal patterns, and current sell-through rate, combined into a demand forecast report available inside Seller Central. In my experience, this forecast is most accurate for established products with a steady sales history and least accurate for new listings or products affected by a recent promotion or viral spike, since the model has less data to work from in those cases.
It is a built-in report inside Seller Central, generally accessed through the Inventory Performance dashboard, that shows expected future sales based on past trends and seasonality. I treat it as one input among several, not a final number, and I always compare it against a seller’s own recent sales data before setting reorder points.
Demand forecasting predicts how much customers will want to buy. Inventory forecasting takes that prediction and turns it into a concrete stock plan, including reorder points, safety stock, and timing. Amazon’s Inventory Performance Dashboard and IPI score are the main tools tied to inventory forecasting specifically.
Sales forecasting focuses on predicting your revenue and unit sales, often factoring in your own planned promotions and ad spend changes, which Amazon’s demand forecast report cannot account for on its own. I build sales forecasts as a layer on top of Amazon’s demand data, not as a replacement for it.
I recommend reviewing your demand forecast weekly and rebuilding your full sales forecast every four to six weeks. Products with high seasonality or frequent promotions need more frequent updates than steady, year-round sellers.
I would not rely on Amazon’s forecast alone for any client. It is a genuinely useful data source, but it does not know about upcoming promotions, competitor stockouts, or supply chain delays on your end. Combining it with your own sales tracking consistently produces better results than using either source by itself.
Conclusion
Running an Amazon store takes planning. Do not wait until stock runs out. Start forecasting today. At Amazon Consultant, we help you stay ahead. Let us guide your Amazon business to success.