Every Amazon seller wants to win. Every seller wants to get more clicks, more sales, and better rankings. To do this, you need smart tools. One of the best tools for this is Amazon Brand Analytics. This tool helps you make better decisions. It shows you what your buyers do and what your competitors miss. Most sellers do not use their data. They guess. That is a mistake. I have sat with clients who were making pricing and advertising decisions purely on gut feeling, while the exact answer was sitting unread in a report inside their own account. Smart sellers use Amazon Brand Analytics to grow their business. They look at the right numbers. They study trends. They take action. That helps them sell more.
This blog will teach you how to use this tool based on what I have actually seen work across real seller accounts, not just the theory. You will learn how to track keywords, check competitors, and spot new trends. You will learn how to turn data into power. Use these tips to stay ahead of your competitors. Learn to grow your store the smart way.
What Is Brand Analytics?
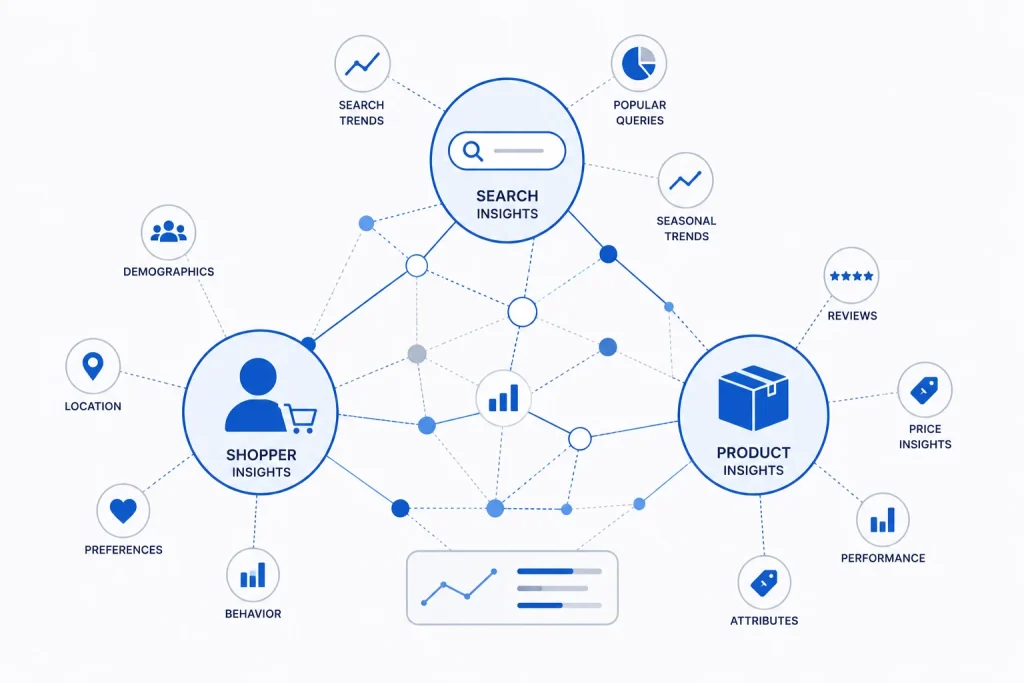
Brand analytics, in the broadest sense, refers to the data and consumer insight tools that help a business understand how buyers find, compare, and choose products under its brand. Most major platforms and analytics providers offer some version of this, but Amazon’s own version is built directly from real Amazon shopper behaviour, which makes it more directly actionable for anyone selling on the platform than a generic third-party analytics tool.
What Is Amazon Brand Analytics?
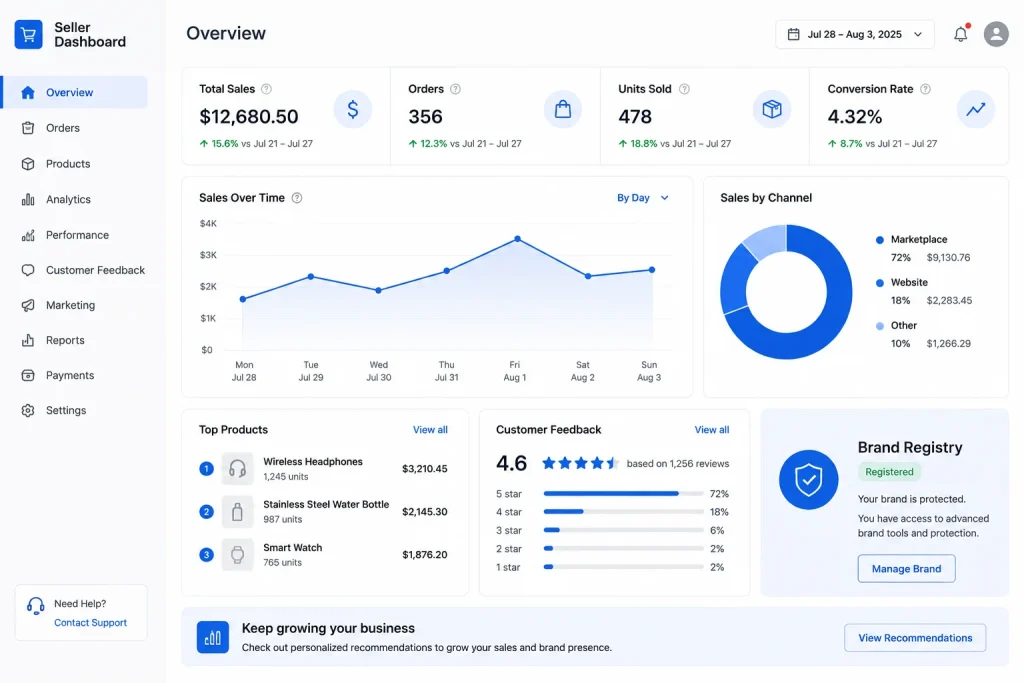
Amazon Brand Analytics is a free tool. It is only for sellers who have a registered brand. If you have a brand in the Amazon Brand Registry, you can use it. This tool gives you data that helps you win. It shows you how your products perform. It shows you what buyers click on. It also shows you what buyers search for. You get this data every week. You can use this data to make better choices.
Smart sellers use this tool every day. They check it often. They use the reports to change their ads. They improve listings. They find better keywords. Amazon Brand Analytics is a must-have tool if you want to beat other sellers. In my own work with clients, the ones who check it weekly consistently catch pricing and listing problems weeks before the ones who only glance at it occasionally.
How to Use Amazon Brand Analytics: Step by Step
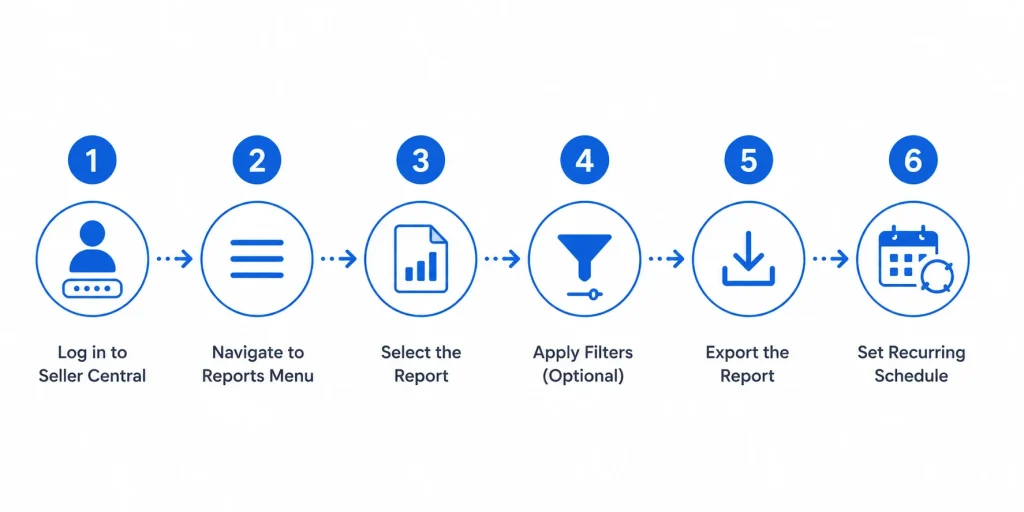
Sellers ask me this constantly, so here is the process broken down clearly.
- Log into Seller Central and confirm your brand is enrolled in Amazon Brand Registry. Without this, you will not see the Brand Analytics option at all.
- Click “Brands” in the top menu, then select “Brand Analytics”.
- Choose the specific report you want to view. Each one covers a different type of buyer behaviour.
- Set your date range and filter by product, category, or search term to focus on what matters right now.
- Export the data if you want to track changes over time, since Amazon Brand Analytics does not keep unlimited historical comparisons in the dashboard itself.
- Build this into a recurring habit rather than a one-time check. I recommend reviewing the core reports weekly and the broader trend reports monthly, which I break down further later in this guide.
The tool itself is genuinely easy to use once you know which report answers which question. The harder part, in my experience, is building the discipline to actually check it on a schedule rather than only opening it when something has already gone wrong.
Understanding the Search Term Report
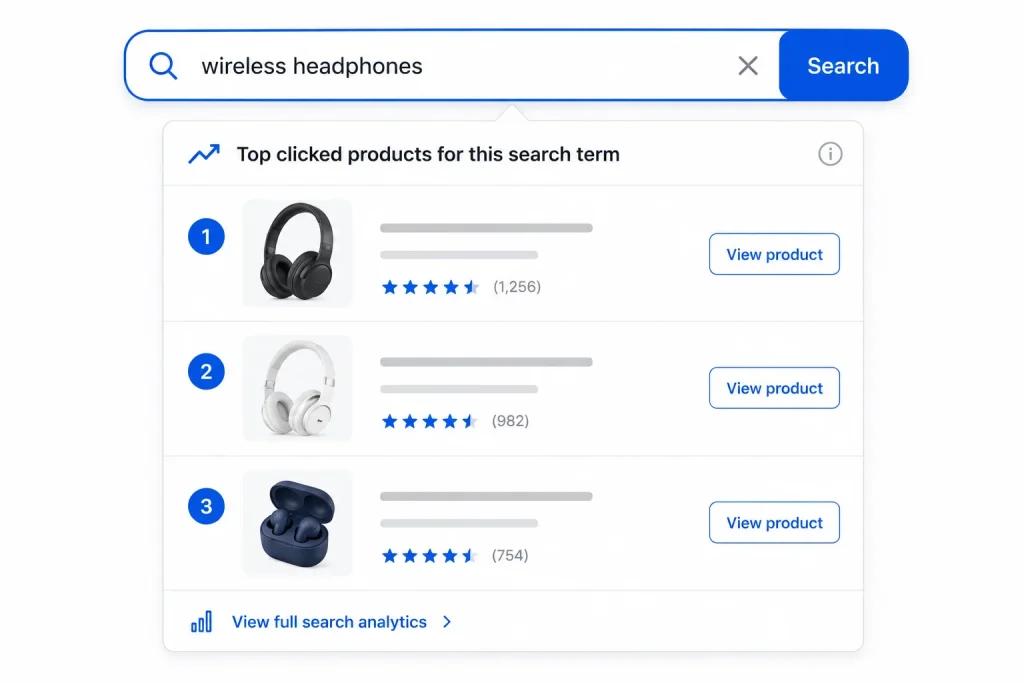
The Search Term Report is one of the best tools inside Amazon Brand Analytics. It shows what people type in the search bar. It shows the top three clicked products for each search term. This report gives you a view of your buyers’ minds. It tells you what they want. It shows you what gets the most clicks. It even tells you what they end up buying. You can find gaps that others miss.
Use this data to update your listings. Make sure your product shows up in those search terms. Add the right keywords. Check which product your buyers choose. Then adjust your pricing or photos to beat that product. I pull this report for every client at the start of each month, and it has caught keyword opportunities that keyword research tools alone missed, simply because this data comes directly from real Amazon search behaviour rather than an estimate.
Analysing the Market Basket Report
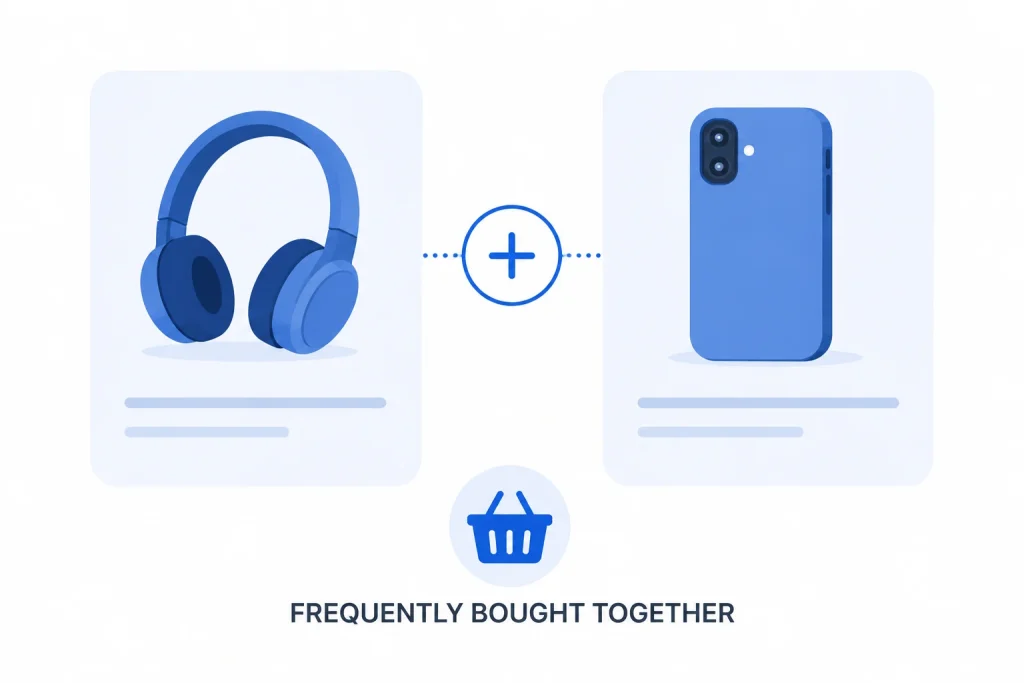
The Market Basket Report tells you what products people buy together. For example, if someone buys a phone, they might buy a phone case too. This tells you what to offer. This report helps you create bundles. You can increase your average order size. You can also understand your customer’s needs better. If you see the same items bought together, list them as a combo.
You can also use this to improve your ads. Promote these bundled items together. That will increase conversions. It will also make your listing stronger. Amazon Brand Analytics gives you the insights you need.
Using the Repeat Purchase Behaviour Report
This report shows you how often people buy your product again. It helps you understand loyalty. It also helps you decide what to promote more. If people keep buying your product again, then your product is great. You can use this to your advantage. Promote it more. Push it in ads. Get reviews from repeat buyers. That helps your product grow fast.
If the report shows low repeat buyers, then something is wrong. Maybe the product is not good. Maybe the price is too high. Maybe the reviews are bad. You can take action to fix these issues. Use the data to improve.
Competitor Intelligence with Amazon Brand Analytics
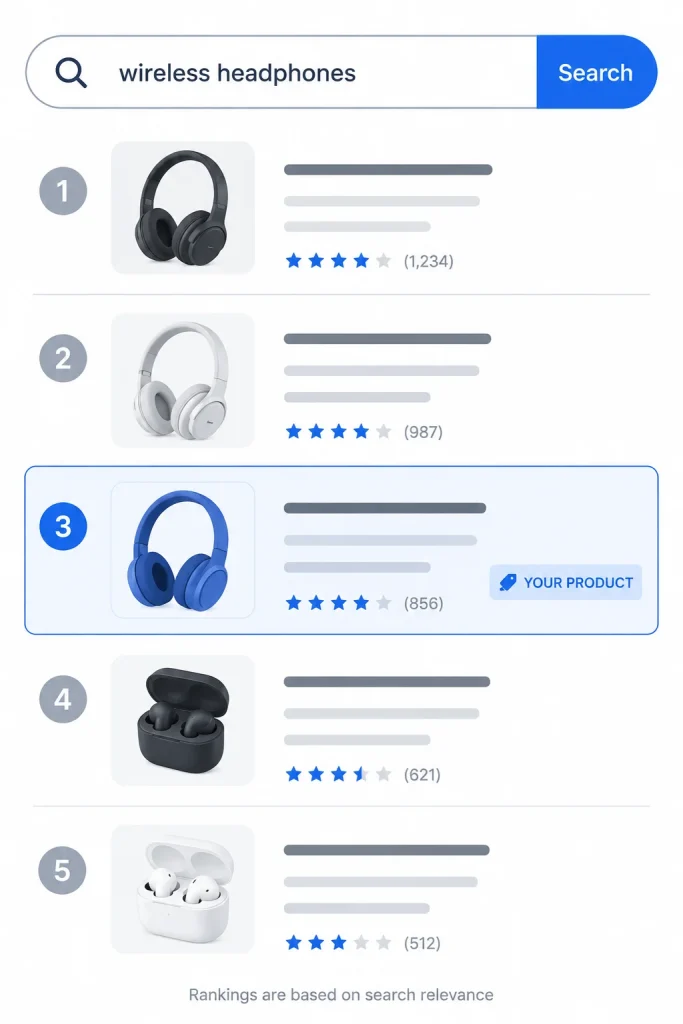
You can use Amazon Brand Analytics to study competitors. It does not show their exact numbers. It shows you trends. It shows you what gets clicks. It shows who wins the buy box.
You can find your top competitors by searching your main keyword. Then you can see which products rank higher. You will see what customers click. Then you can make better listings. You can also see what keywords help your competitors rank. Then you can add those keywords. You can create better content. You can win their customers. You can take their market share by making smart, data-backed moves rather than guessing at what they are doing right.
Amazon Brand Analytics Report Overview: Which Reports to Check and When
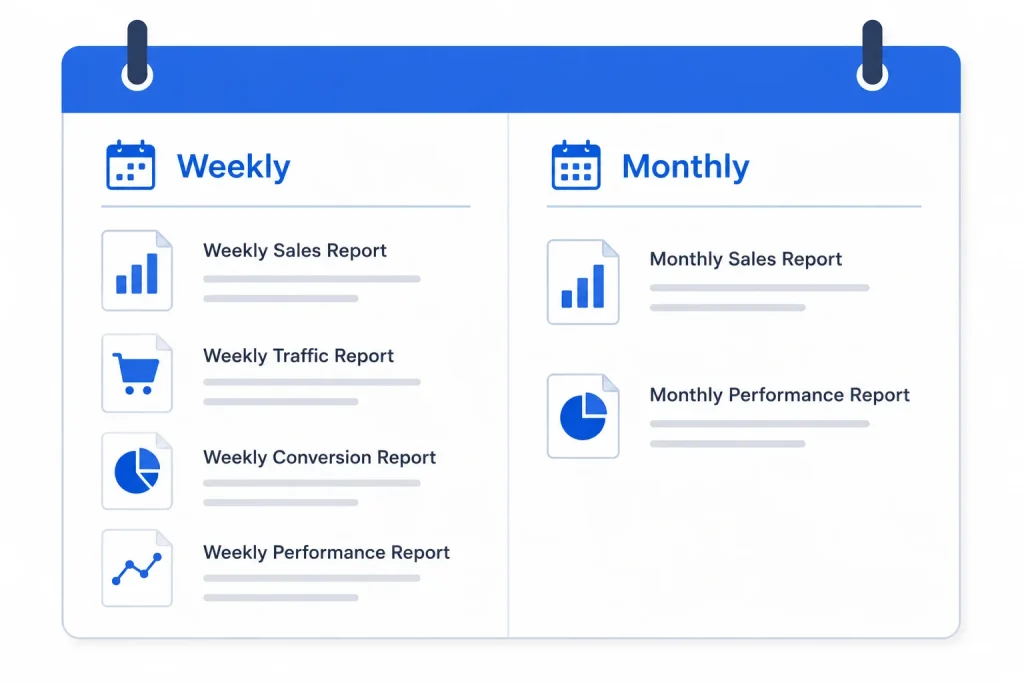
Sellers must stay informed. You must keep checking Amazon Brand Analytics reports. These reports help you sell smarter. They guide your business growth.
Key reports to check weekly:
- Search Term Report: Find out which search terms bring buyers.
- Market Basket Report: See what products are bought together.
- Repeat Purchase Report: Know which items customers buy again.
- Item Comparison Report: Find out which products compete with yours.
Key reports to check monthly:
- Demographics Report: Learn about age, gender, income, and more.
- Performance Over Time Report: Check sales trends. Spot drops or spikes in sales.
I treat this weekly and monthly split as the backbone of how I manage every client account. Checking everything daily wastes time on noise, and checking only monthly means real problems sit unnoticed for weeks.
Brand Analytics Tools and Solutions Compared
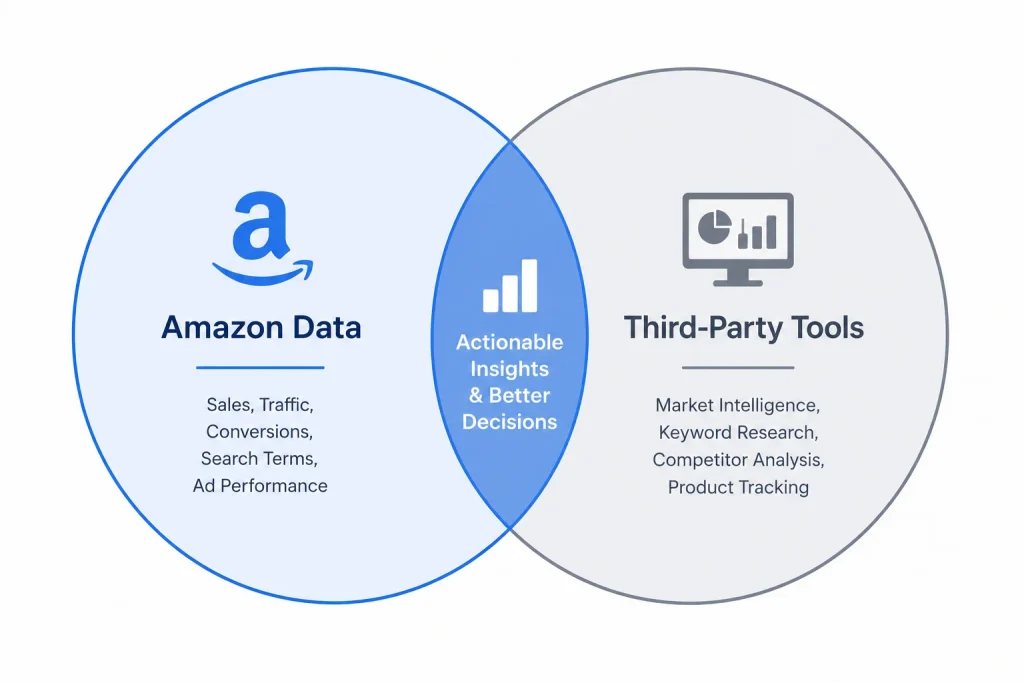
Amazon Brand Analytics is not the only brand analytics solution available to sellers, and I think it is worth being upfront about where it fits. Third-party tools like Helium 10, Jungle Scout, and Data Hawk offer their own brand analytics tools, often layering estimated market data and cross platform tracking on top of what Amazon shows you directly.
In my experience, Amazon Brand Analytics wins on accuracy for anything happening specifically within Amazon’s own search results, since it comes straight from Amazon’s own data rather than an estimate. third-party tools tend to win on broader market context, competitor tracking cross-platform , and historical trend storage that Amazon’s own dashboard does not offer. I generally recommend using Amazon Brand Analytics as your primary source of truth and a third-party tool as a supplement, rather than choosing one over the other.
Boosting Conversions Using Brand Analytics
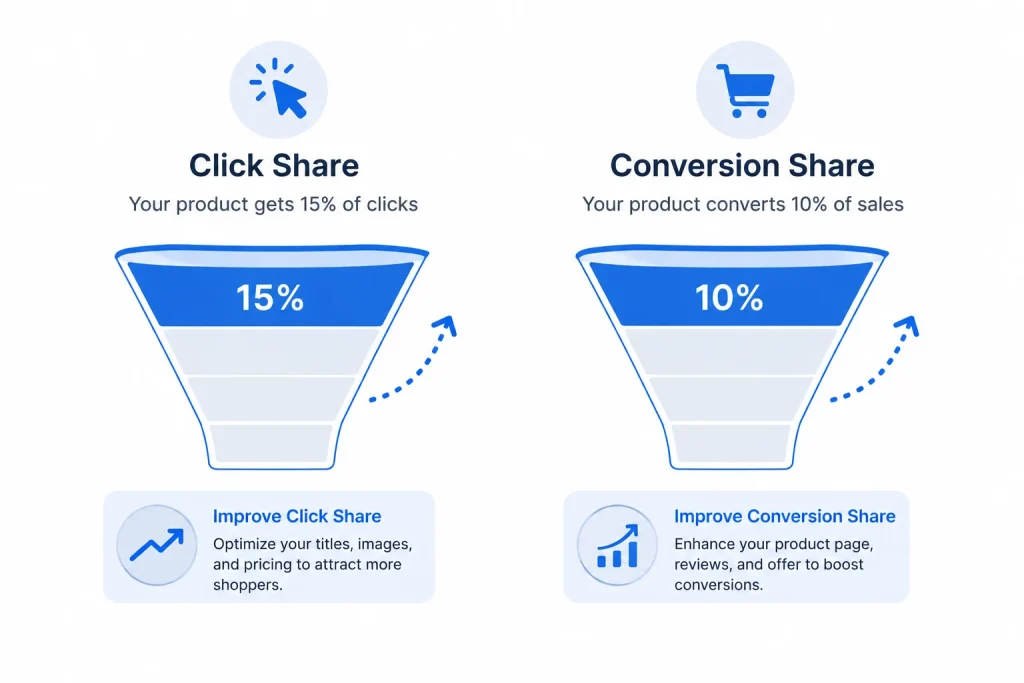
You can boost your sales using Amazon Brand Analytics. The data shows you what works. Then you take action. That gives you results fast. Check the click share and conversion share from the Search Term Report. If your click share is low, then improve your image. If conversion share is low, then change your product detail page. Try better bullets. Use stronger headlines.
You can also find new keywords. Then you add them to your listing. This brings more buyers. Use the top-performing search terms. Create ads using those keywords. You will get better sales.
Outranking Competitors in Product Listings
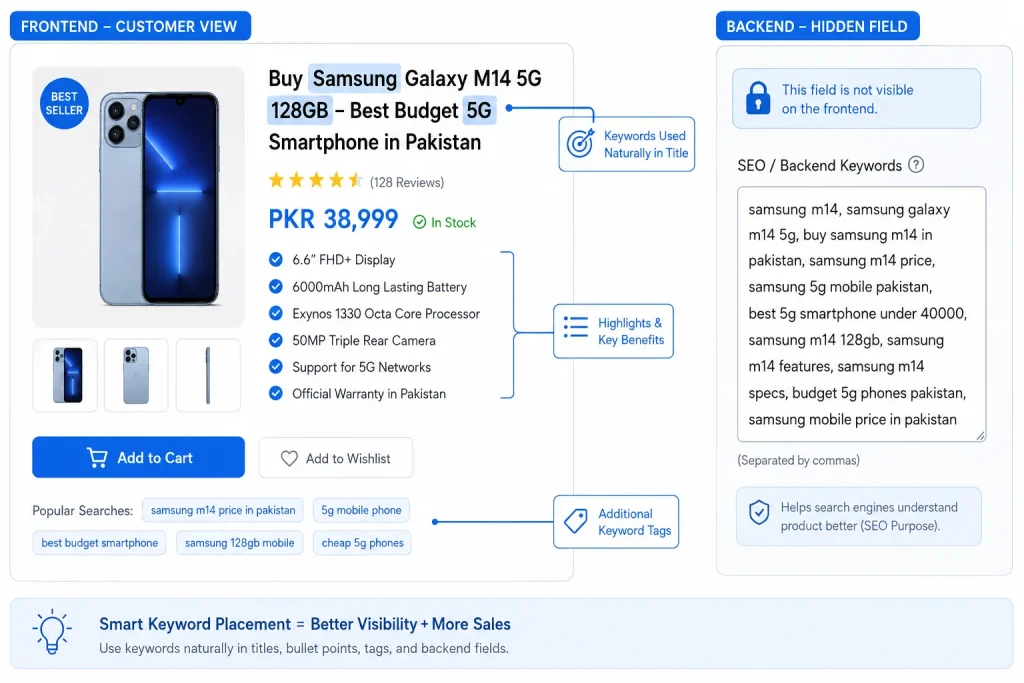
Use Amazon Brand Analytics to rank higher than your competitors. First, check which keywords bring them traffic. Then target those keywords. Add them to your title, bullet points, and backend search terms. Check the click-through rate of their listings. You can find out what kind of images or titles work. Then make your listing better. Use high-quality photos. Write clear and bold benefits. Create stronger product copy.
If you do this often, you will start to see results. Your product will show up higher. You will get more views. That leads to more conversions. All this comes from using your data smartly.
Case Studies: Amazon Brand Analytics in Practice
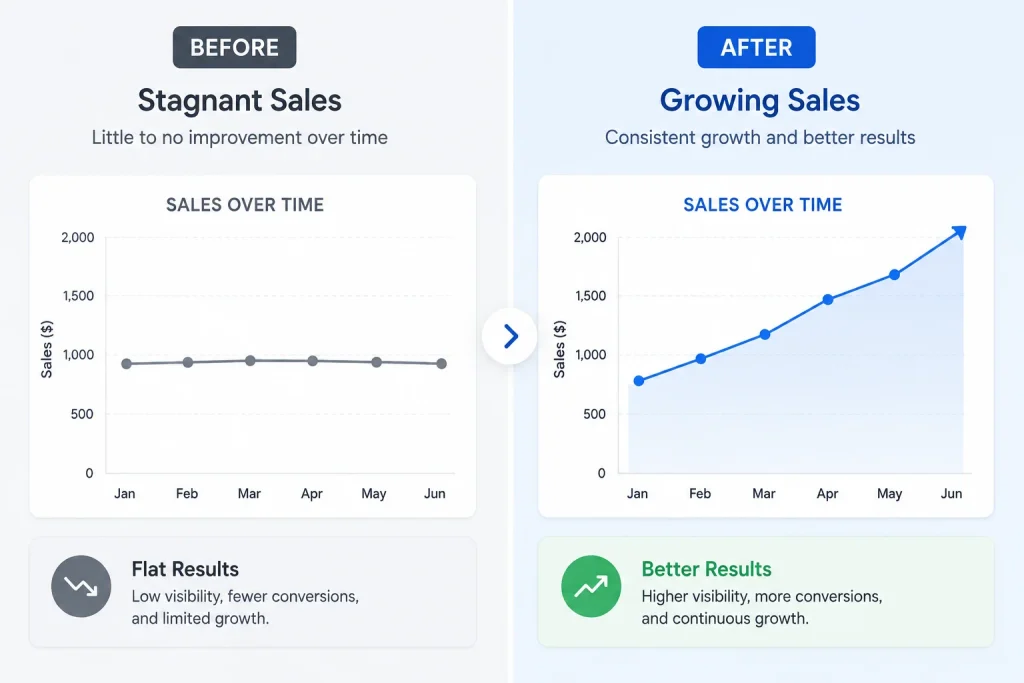
Case Study 1: Finding a Missed Keyword Worth Thousands in Sales
A client selling kitchen storage containers had a solid listing but flat sales for months. I pulled their Search Term Report and found a high-volume search term where their product appeared in results but had a noticeably low click share compared to the top three products for that term. Their main image was the issue, a plain white background shot while competitors used lifestyle images showing the product in actual use. After we updated the main image and added that exact search term into the listing title, their click share on that term roughly doubled within three weeks, and it became one of their top revenue drivers for the quarter.
Case Study 2: Using the Market Basket Report to Build a Bundle That Actually Sold
Another client sold individual yoga accessories separately, a mat, a block, and a strap, with no bundle option. I reviewed their Market Basket Report and confirmed that a meaningful share of buyers who purchased the mat were also buying the block within the same order window. Rather than guessing at a bundle, we built one based directly on that confirmed buying pattern. The bundle listing outperformed our initial sales projection within the first month, and it also improved their average order value across that product line without cannibalising sales of the standalone items.
Creating a Long-Term Strategy Using Brand Analytics
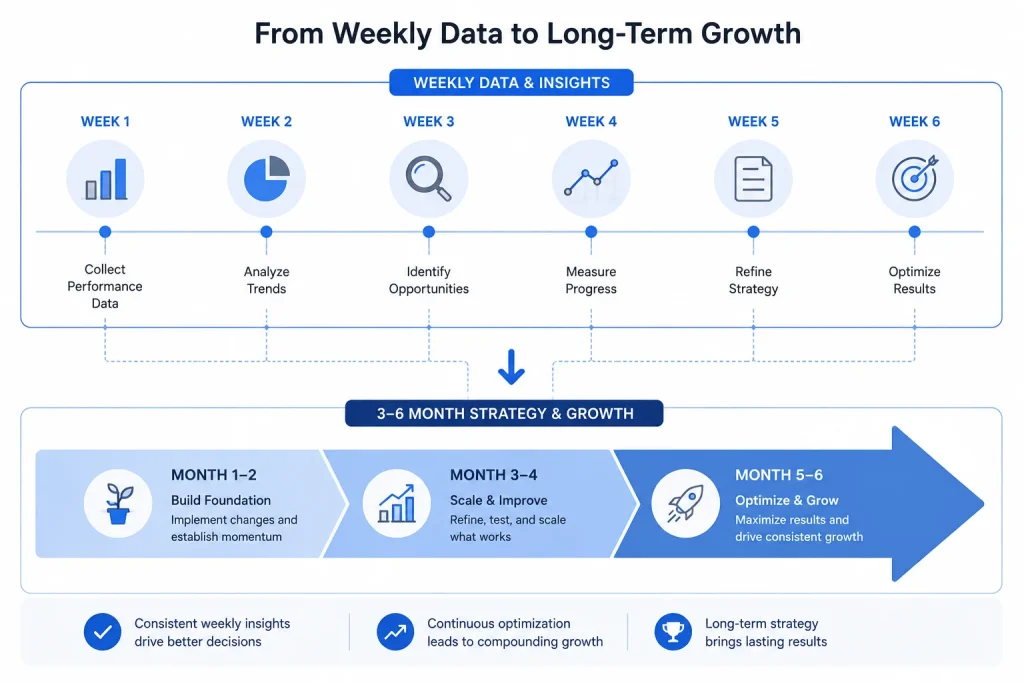
Use Amazon Brand Analytics not just for short-term gains. Use it for your long-term strategy. Keep tracking your data every week. Then build a three-month or six-month plan. Use the data to launch new products. If many people buy two products together, then launch a combo. If a keyword keeps trending, then make new content around that keyword. You will grow faster.
Track your top-performing products. Then invest more into ads for those. Remove the slow ones. Focus on what brings in revenue. Let data guide your strategy.
Frequently Asked Questions About Amazon Brand Analytics
It is a free suite of reports available to sellers enrolled in Amazon Brand Registry, showing real buyer search and purchase behaviour directly from Amazon’s own data. It covers search terms, repeat purchase patterns, bundled buying behaviour, and competitor-level trends.
Log into Seller Central, confirm your brand is registered, and navigate to Brands, then Brand Analytics. From there you select a specific report, filter by date range or product, and use the data to inform listing, pricing, or advertising decisions. I recommend building a weekly and monthly review habit rather than checking it only occasionally.
Yes, UK sellers with a brand registered in Amazon Brand Registry have full access to Brand Analytics through their UK Seller Central account, with the same reports available in other Amazon marketplaces.
It refers to any of the individual data views inside the tool, such as the Search Term Report, Market Basket Report, or Repeat Purchase Report. Each one answers a different question about buyer behaviour, so I think of them as a report suite rather than one single report.
Not necessarily, but it depends on your goals. Amazon Brand Analytics is the most accurate source for what is actually happening inside Amazon’s own search results. A paid third-party tool becomes useful if you also want broader market estimates, cross-platform competitor tracking, or longer historical data storage than Amazon’s dashboard provides.
Yes, this is genuinely one of the services we help clients with directly, from getting properly set up in Brand Registry to building a weekly reporting habit and turning the data into real listing and advertising decisions.
Conclusion
Amazon Brand Analytics gives you the power to sell better. You can track keywords, study search terms, and beat your competitors. You can improve listings. You can change your strategy. You can grow smart and fast. The best sellers do not guess. They use data. They act with purpose. They use this tool every week. You should do the same. Start using the reports today. Learn from them. Use them to lead your market.
If you want help with using Amazon Brand Analytics the right way, then visit our website. Our expert team at Amazon Consultant will guide you step by step.