Setting clear KPIs is one of the most important steps for every Amazon seller who wants to grow in 2026. These key performance indicators show the health of your Amazon store. They help you track results and plan future actions.
I have built KPI tracking systems for sellers ranging from single-product stores to full catalougs with dozens of SKUs, and the pattern I see most often is not a lack of data, it is too much of it with no clear dashboard pulling it together into something a person can actually act on in five minutes each morning. When you set strong KPIs, you can measure your success in numbers. You can spot weak areas and take fast action. You can also keep your Amazon team focused on what really matters.
In 2026, Amazon sellers need to move fast. The market changes daily. Strong KPIs will guide you like a compass. You can stay on the right path and improve step by step.
Why KPIs Matter for Amazon Sellers in 2026

KPIs matter because they give you clear goals. These goals will guide every action you take in your Amazon business. When you set the right goals, you will always know your direction. Many Amazon sellers guess what is working. This creates confusion. If you use data-driven KPIs, you can focus your time and money better. You will stop wasting effort on low results.
In 2026, smart sellers will set strong KPIs that match their goals. These metrics will push their business to grow. They will stay ahead of the market and keep customers happy.
How to Define Your Business Goals First
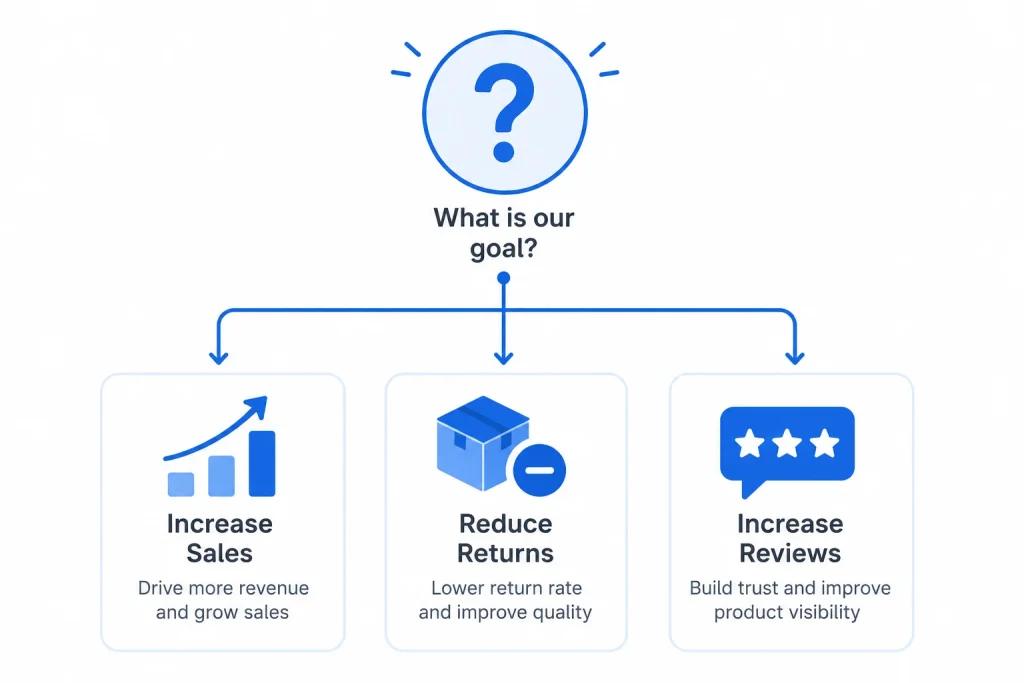
Before setting KPIs, you must define your business goals clearly. These goals will shape every decision you make in your Amazon journey. Without clear goals, you will always guess. You can ask questions like: Do you want to grow your sales or reduce returns? Do you want better customer reviews or more repeat buyers? These answers will guide your next steps.
Once you have strong goals, you can choose the right KPIs. Each KPI will match a goal. This way, your daily work will bring results that match your targets.
Choose the Right KPIs Based on Your Amazon Business Type
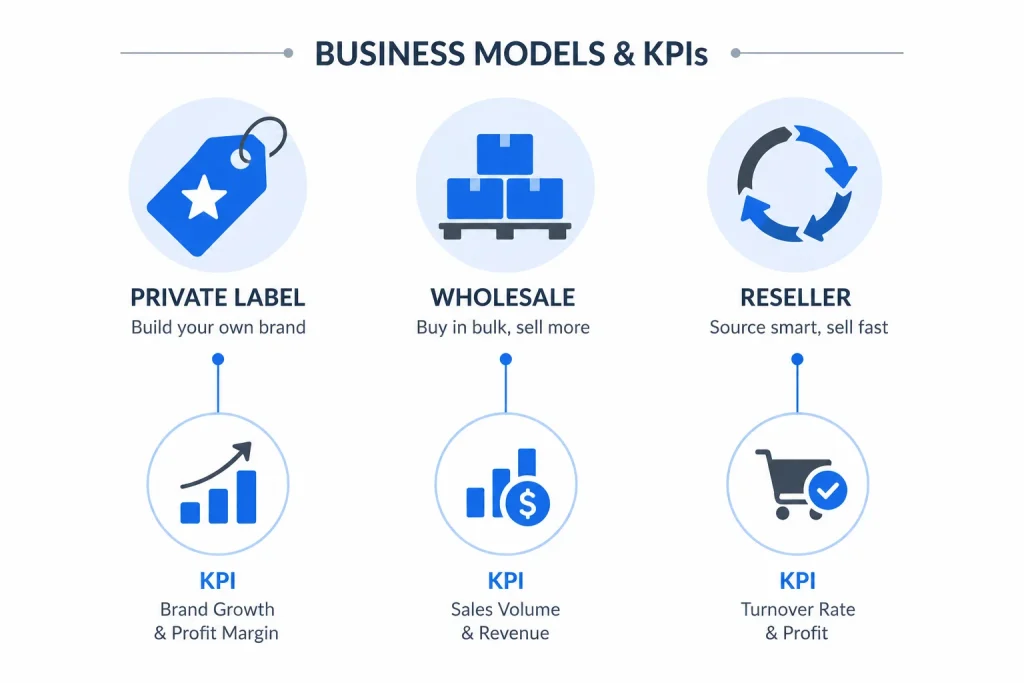
Each Amazon seller runs a different kind of business. You may be a private label seller, a wholesaler, or a reseller. Your KPIs must match your model. If you sell your own brand, you may track KPIs like branded search volume or repeat customers. If you resell others’ products, you may track inventory turnover or buy box percentage.
Different businesses need different KPIs. When you match your KPIs to your business type, you will see faster growth. Your numbers will reflect your true performance.
Amazon KPI Examples: Top KPIs Every Seller Must Track in 2026
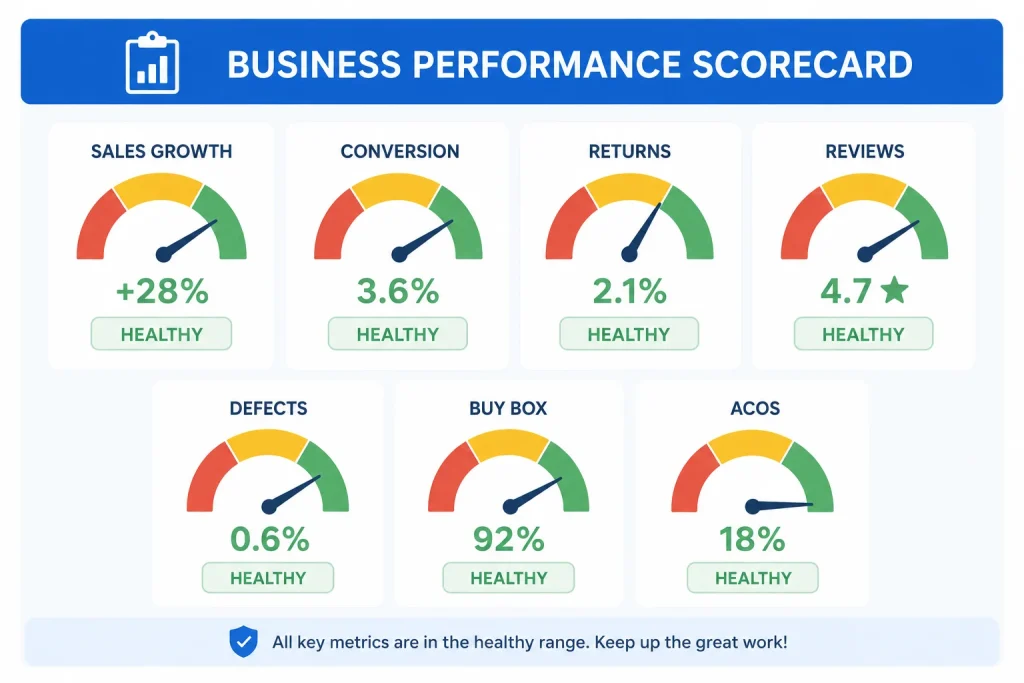
In 2026, there are some powerful KPIs every Amazon seller should track. These numbers show you where you are winning and where you are losing. Here are real KPI examples with what a healthy range typically looks like, based on the accounts I manage:
| KPI | What It Measures | Typical Healthy Range |
| Sales Growth Rate | How fast your sales are growing over time | Positive and steady, month over month |
| Conversion Rate | How many visitors buy after seeing your product | 10 to 15% for most categories |
| Return Rate | How many buyers send back your product | Under 5% for most categories |
Customer Review Score | How happy your customers feel | 4.3 stars or higher |
| Order Defect Rate | How many orders have issues | Under 1%, ideally near 0% |
Buy Box Percentage | How often you win the Buy Box | 90% or higher for single seller listings |
| Advertising Cost of Sale (ACoS) | Ad spend compared to ad sales | Varies by category, generally under 25 to 30% |
I want to be honest that these ranges are starting benchmarks, not universal rules. A newly launched product will naturally have a higher ACoS than a mature bestseller, and that is expected, not a red flag on its own. Track these KPIs weekly or monthly. These numbers will give you a full view of your business health.
Amazon Listing Quality KPIs and How to Improve Product Listings
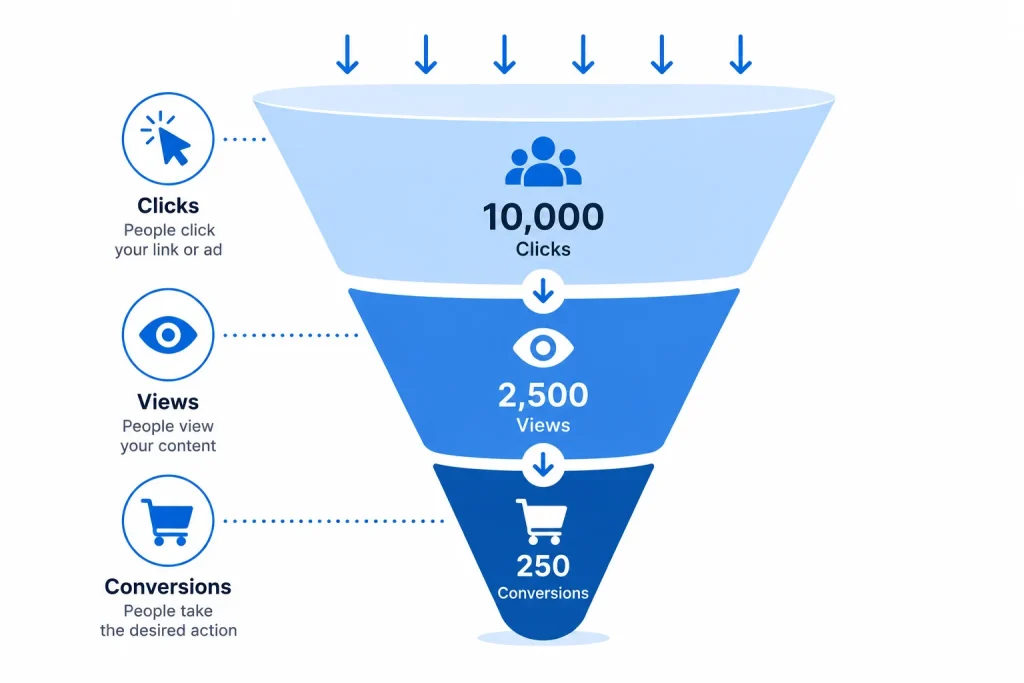
Product listings are the heart of your Amazon success. Your titles, images, bullets, and descriptions must grab attention. Your listing quality KPIs, specifically click-through rate, conversion rate, and bounce behaviour, can tell you if they work. Use your KPIs to check how many clicks and conversions each listing gets. Low numbers mean your listing needs improvement. High bounce rates mean shoppers lose interest fast.
Change your listings based on what your KPIs show. You can test new images, update bullet points, or add keywords. Use your data to guide every change you make. I run a listing quality check monthly for every client, looking specifically at conversion rate against category averages, since a listing that looks fine on the surface can still be quietly underperforming what a stronger version could achieve.
Set Weekly, Monthly, and Quarterly KPI Targets
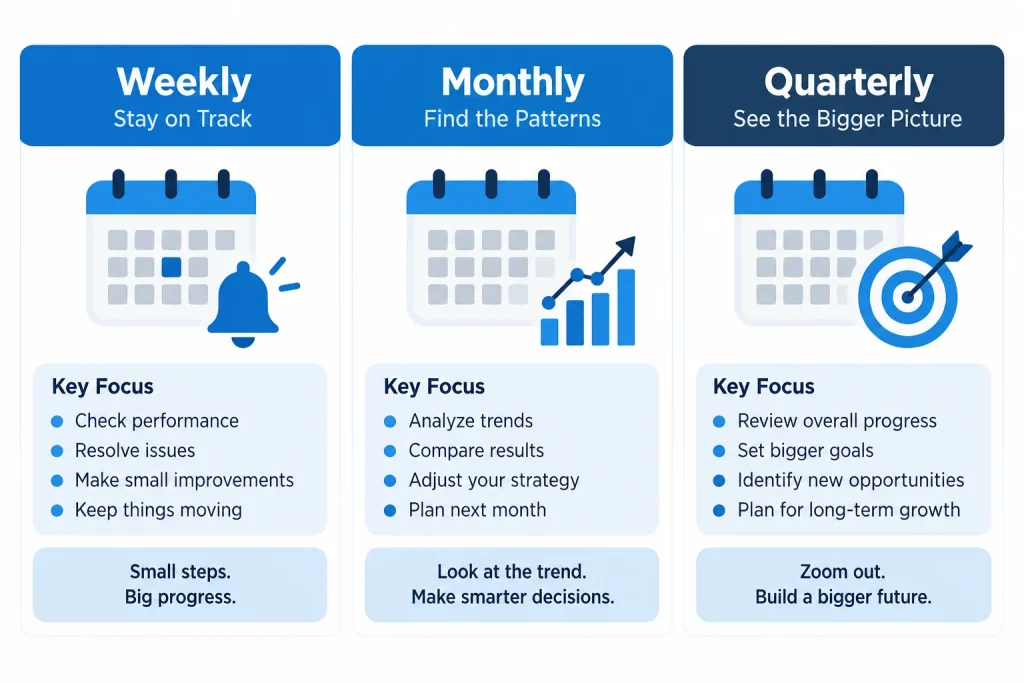
Short-term and long-term targets help you grow steadily. Weekly KPIs help you stay active and responsive. Monthly KPIs show patterns. Quarterly KPIs help you plan for big changes. You should not wait three months to know something is wrong. Your weekly KPIs will alert you early. Then, you can fix problems before they grow.
Make sure all your targets are clear and reachable. Use your past data to set goals. Update your KPIs as your business grows in 2026.
Monitor Team Performance Using KPIs

Your Amazon team must stay aligned with your business goals. You can use KPIs to track each team member’s output and results. This helps build trust and focus. Use KPIs for customer support teams. Track how fast they reply or solve cases. Use KPIs for your warehouse teams. Track how fast they ship orders.
Share your KPIs with your full team. When everyone knows their numbers, they work smarter. This makes your whole Amazon business run better in 2025.
Amazon Advertising KPIs: Use KPIs to Optimise Your Amazon Ads
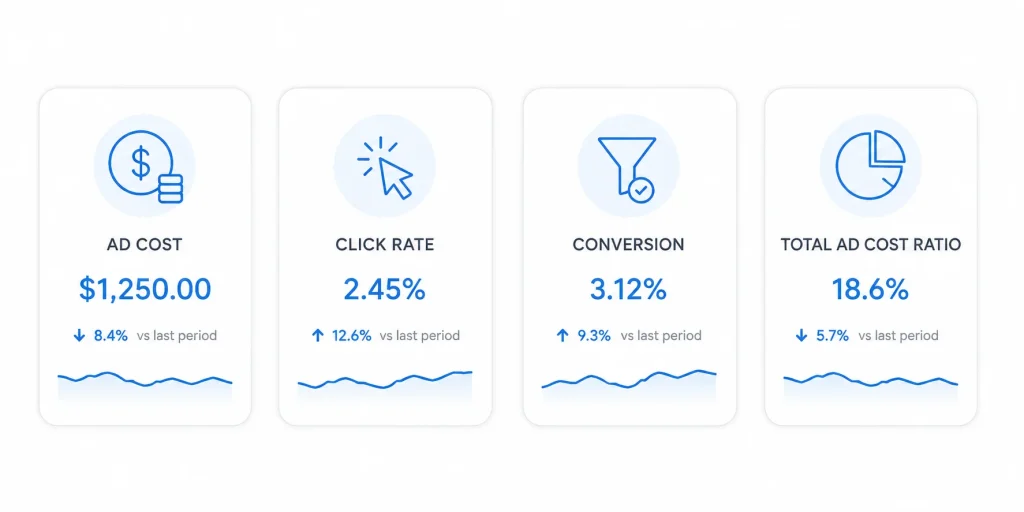
Amazon advertising costs more each year. You must use advertising-specific KPIs to stay profitable. The right metrics will tell you if your ads work well or waste money.
The core Amazon advertising KPIs I track for every client are ACoS, click-through rate, conversion rate on ad clicks specifically, and TACoS, which measures ad spend against your total sales rather than just ad-attributed sales. If you want the full breakdown of how ACoS and TACoS work together, I cover that in detail in our guide to understanding TACoS vs ACoS metrics, since the two numbers tell very different parts of the same story.
Create strong ad reports weekly. Use your KPIs to adjust bids and change targets. Make data-driven choices every time. This will grow your sales and protect your margins.
Use KPIs to Manage Inventory More Effectively
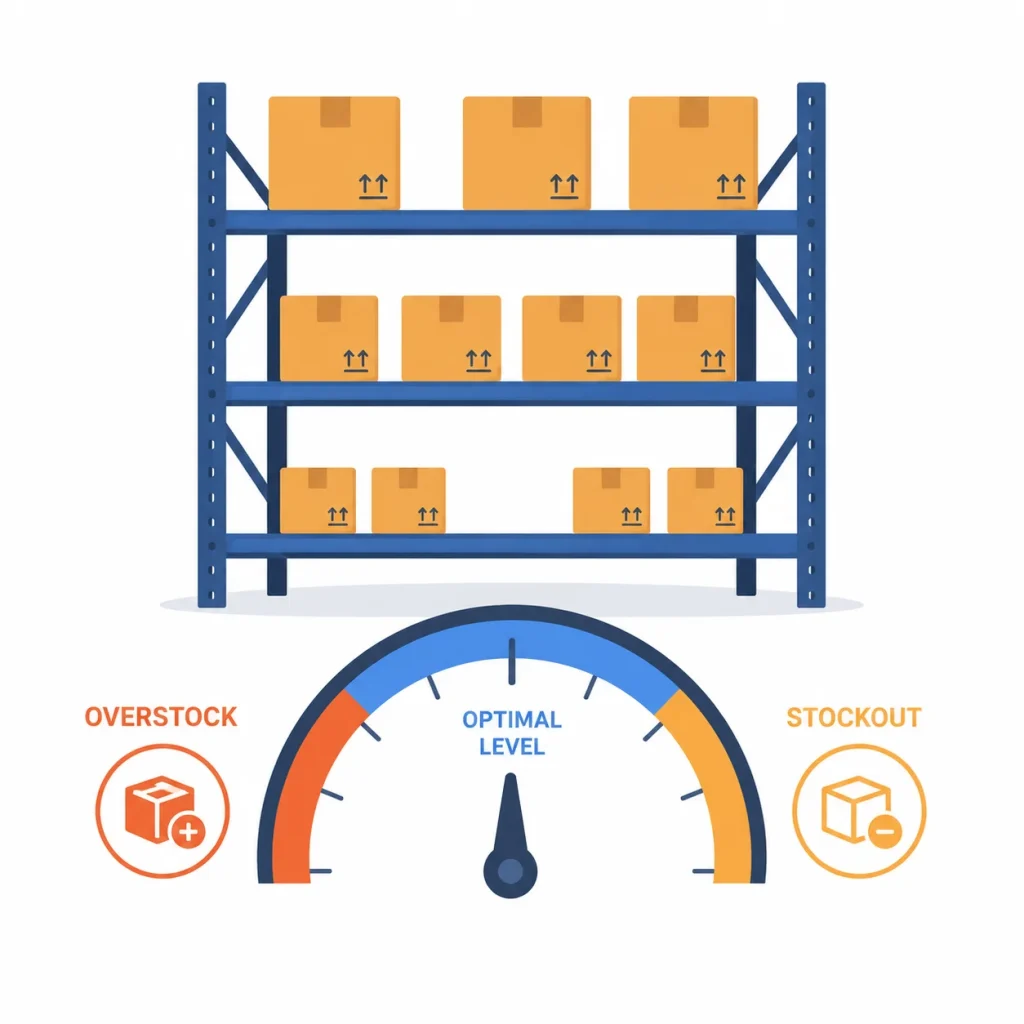
Inventory issues can hurt your Amazon growth. Overstock means wasted money. Stockouts mean lost sales. Smart KPIs help you avoid both problems. Track your sell-through rate. This KPI shows how fast your products move. Track your restock rate. This helps you avoid running out during peak sales.
Use reports to predict busy seasons. Let your KPIs guide your orders. When you manage inventory well, your store stays healthy and ready to scale.
Adjust KPIs Based on Seasonality and Trends
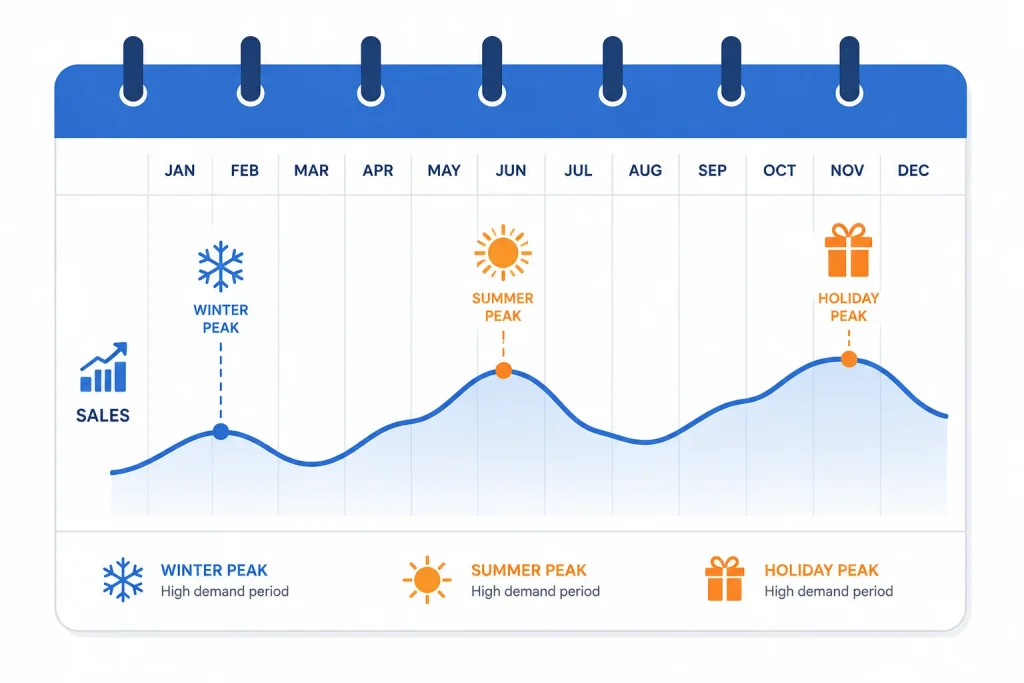
In 2026, trends shift fast. Shoppers want new things often. Seasonality also plays a big role. Your KPIs must adjust for these changes to stay relevant. You can track how your products perform in holiday seasons or during special events. You can also adjust your ad goals to match new trends.
Check your KPIs every month. If you see a drop, ask why. Adjust fast. Use these changes to build new goals that match what your customers want now.
Review and Improve Your KPIs Regularly
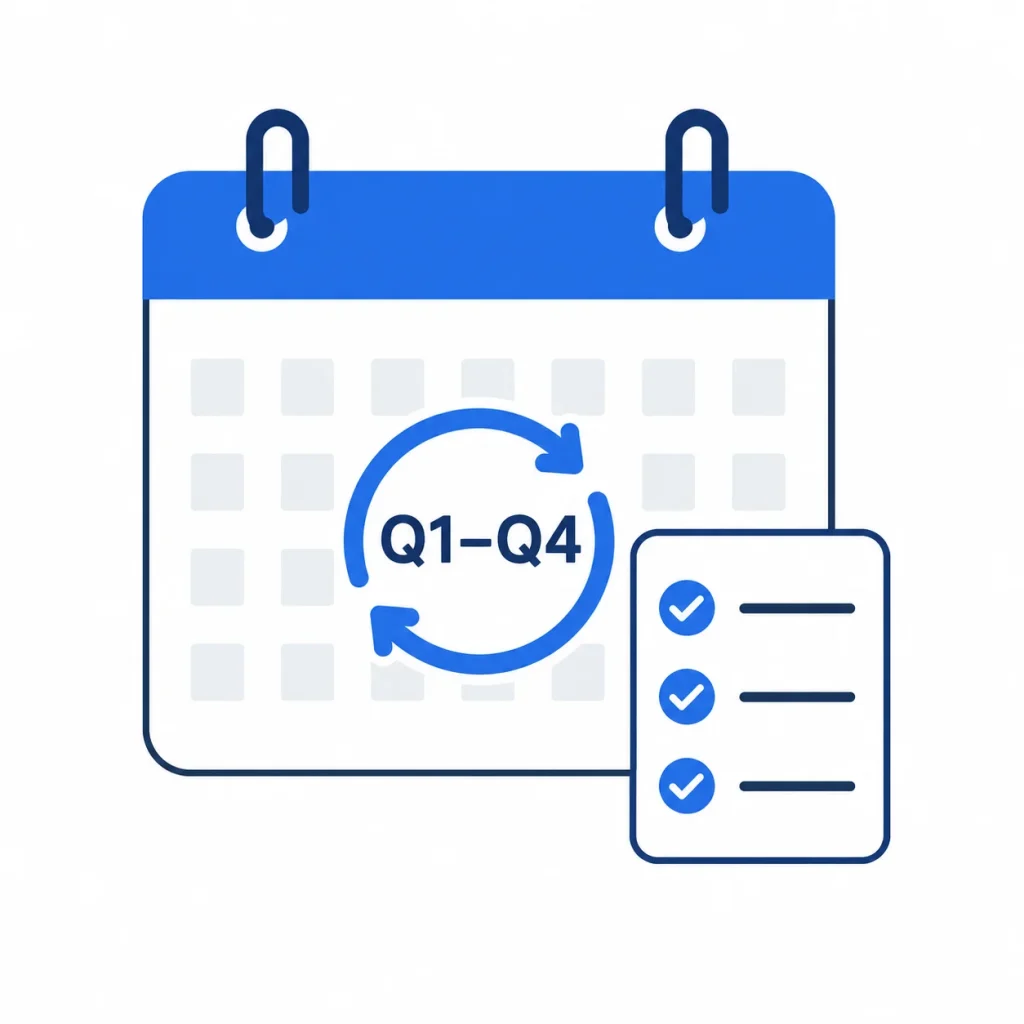
Your KPIs must grow with your business. A KPI that worked last year may not fit now. Review your full list of KPIs every three months. Ask yourself if each KPI still matches your goals. If not, update it. Keep only the KPIs that help you take action fast and clearly.
Look at your Amazon performance weekly. Spot patterns early. Your KPIs must stay useful, simple, and sharp. This will help you win in 2026.
Make Data-Driven Decisions Based on Your KPIs
Data removes guesswork. Your KPIs give you facts. You can use these numbers to make smarter decisions for your Amazon business. When your conversion rate drops, check your images or price. When your ACoS grows, test your keywords. Let your KPIs lead every change.
Never rely on luck. Let your numbers guide you. Strong KPIs will help you move fast, fix problems, and grab new growth chances in 2026.
Set-SMART KPIs That You Can Actually Reach
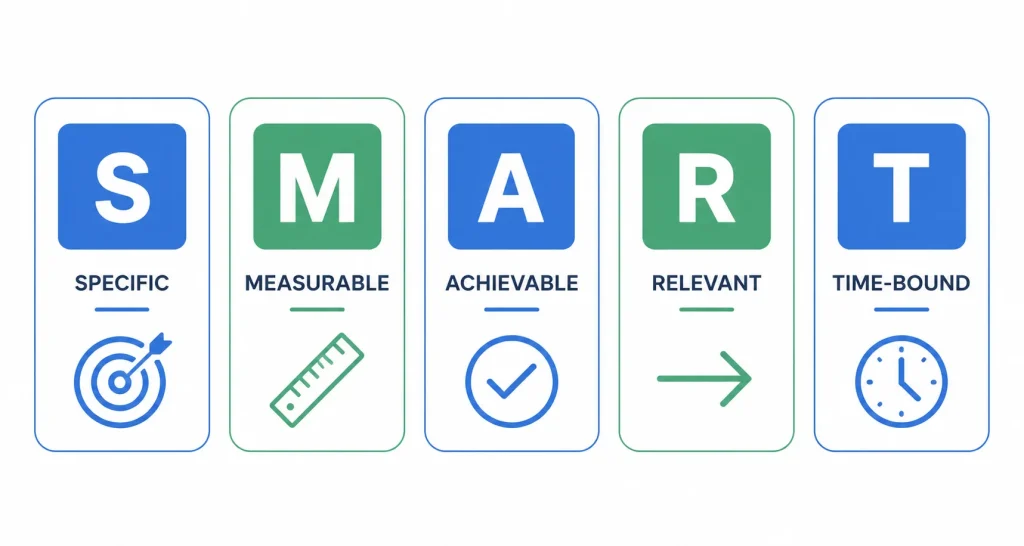
Set SMART KPIs for real growth. SMART means specific, measurable, achievable, relevant, and time bound. These KPIs will give you strong and clear goals. Avoid setting KPIs like “grow more”. Use goals like “increase sales by 20% in 90 days. ” Make sure every KPI is something you can track and achieve.
When your KPIs are SMART, you will feel more focused. Your team will stay motivated. Your business will keep growing with purpose.
How to Build an Amazon KPI Dashboard
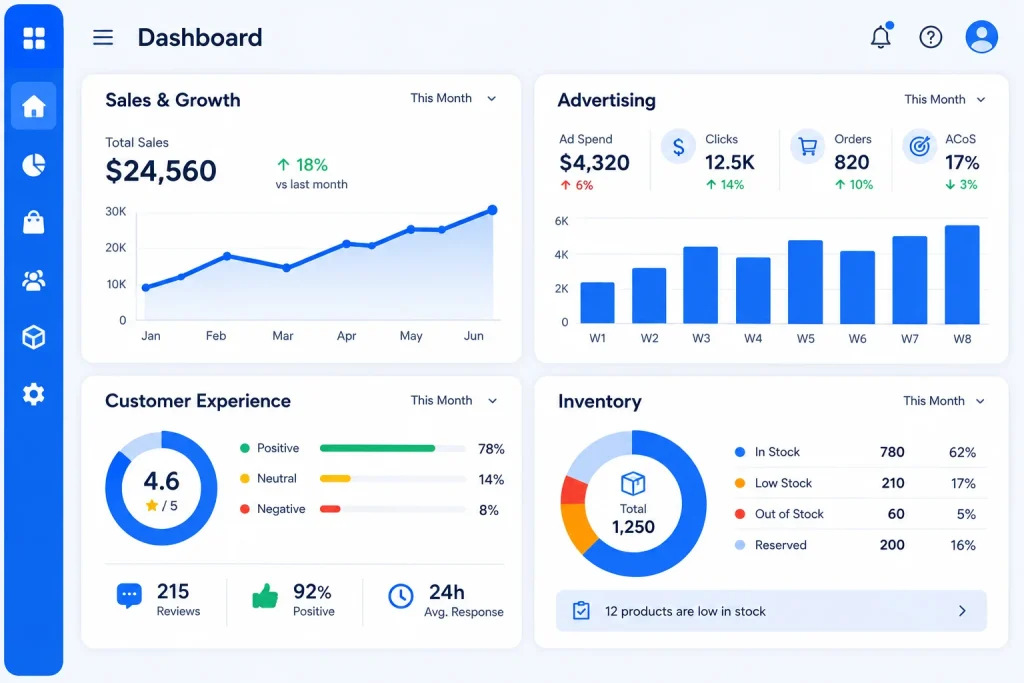
This is the part sellers ask me about more than anything else in this whole topic, so I want to actually walk through it properly rather than leave it as a vague suggestion. A real Amazon KPI dashboard pulls data from a few different sources into one place you can check in a few minutes, rather than logging into five separate reports every morning. Here is how I structure one for clients:
Section 1: Sales and Growth Daily and weekly units sold, revenue, and sales growth rate compared to the previous period, pulled from Seller Central’s Business Reports.
Section 2: Advertising ACoS, TACoS, click-through rate, and ad spend, pulled from Amazon Advertising reports or a tool like Sellerboard that consolidates this automatically.
Section 3: Customer Experience Return rate, order defect rate, and current review score, pulled from Seller Central’s Voice of the Customer and Account Health dashboards.
Section 4: Inventory Sell-through rate, current stock levels, and restock alerts, pulled from your Inventory Performance Dashboard.
For the actual dashboard itself, sellers generally choose one of three routes. A simple Google Sheets or Excel template works well for single product sellers who just need the numbers in one tab, refreshed manually once a week. Sellerboard and similar profit analytics tools build a live dashboard automatically by connecting directly to your Seller Central account, which I recommend once you are managing more than a handful of SKUs. For larger catalogues, some of my clients use Looker Studio connected to exported Amazon data for a fully custom dashboard, though that requires more setup time upfront.
I generally tell new clients to start with a simple spreadsheet dashboard first, prove out which KPIs they actually check and act on, then upgrade to an automated tool once the habit of checking it daily is already built. Buying an expensive dashboard tool before you have that habit tends to just become another unused subscription.
Use Software Tools to Track Your KPIs Easily
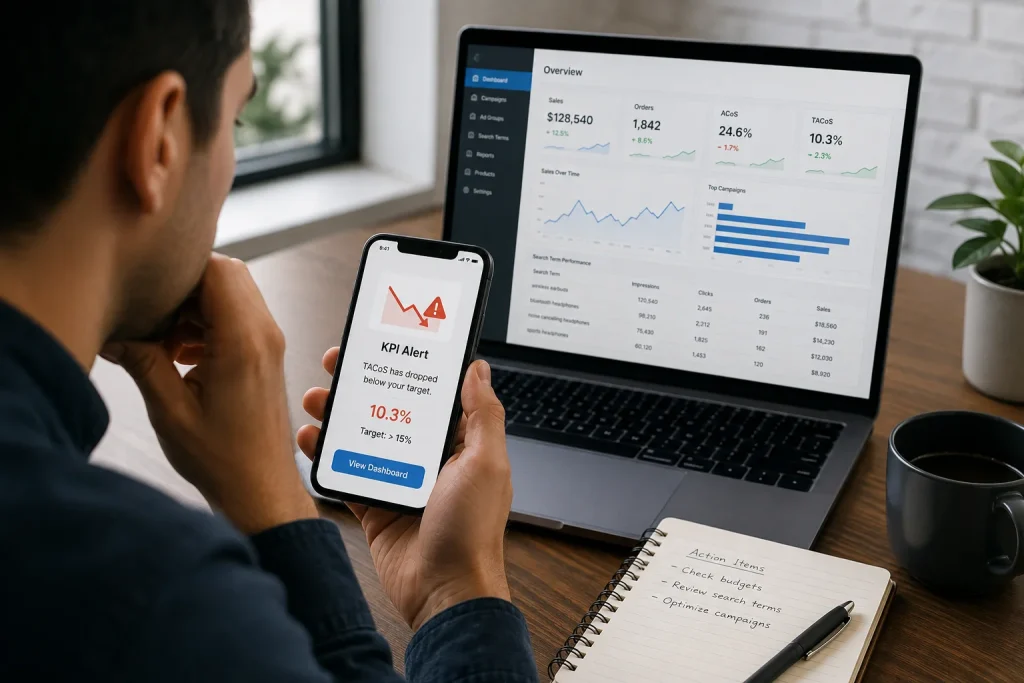
Many Amazon sellers waste hours in spreadsheets. Use tools that track your KPIs fast and clearly. These tools save time and give clear dashboards. Look for tools that show sales, ad results, returns, and reviews. Choose software that updates daily and sends alerts when KPIs drop.
Software will help you focus on action. You will not get lost in data. You will always know what is working. This will help you make smart choices faster in 2026.
Create KPI Dashboards for Easy Tracking
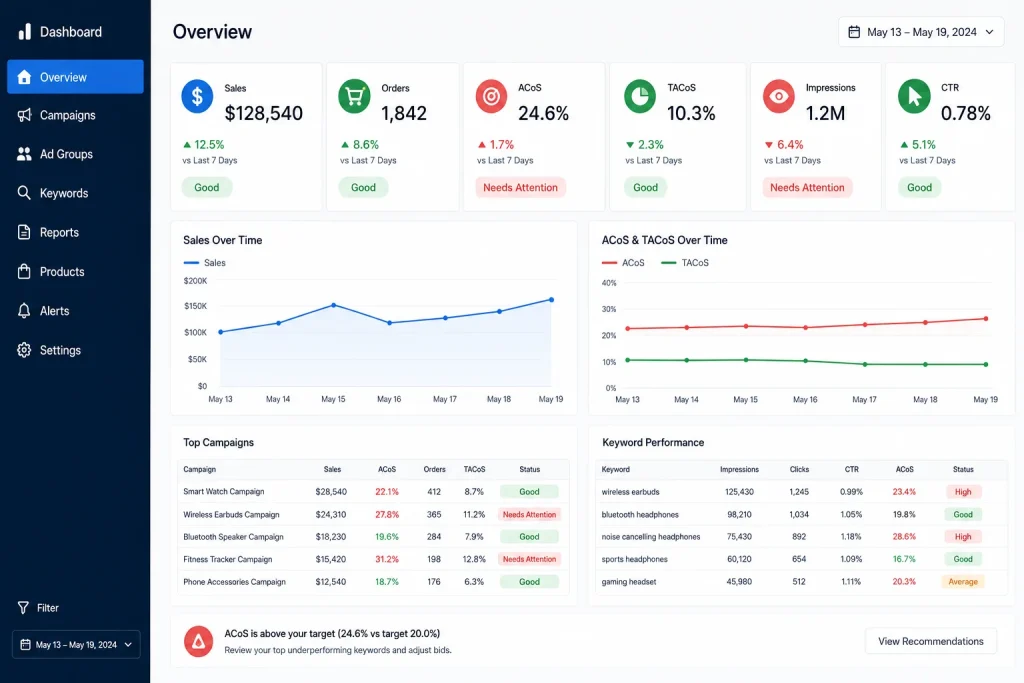
Use dashboards to see all your KPIs in one view. A simple screen shows your sales, traffic, returns, and ads. You get full control in seconds. Your dashboard should update often. Use colours and charts. Red means a problem. Green means growth. This way, you spot changes fast.
Check your dashboard daily. Share it with your team. Let everyone stay aligned. This keeps your Amazon store strong and growing each week.
Case Studies: Amazon KPIs in Practice
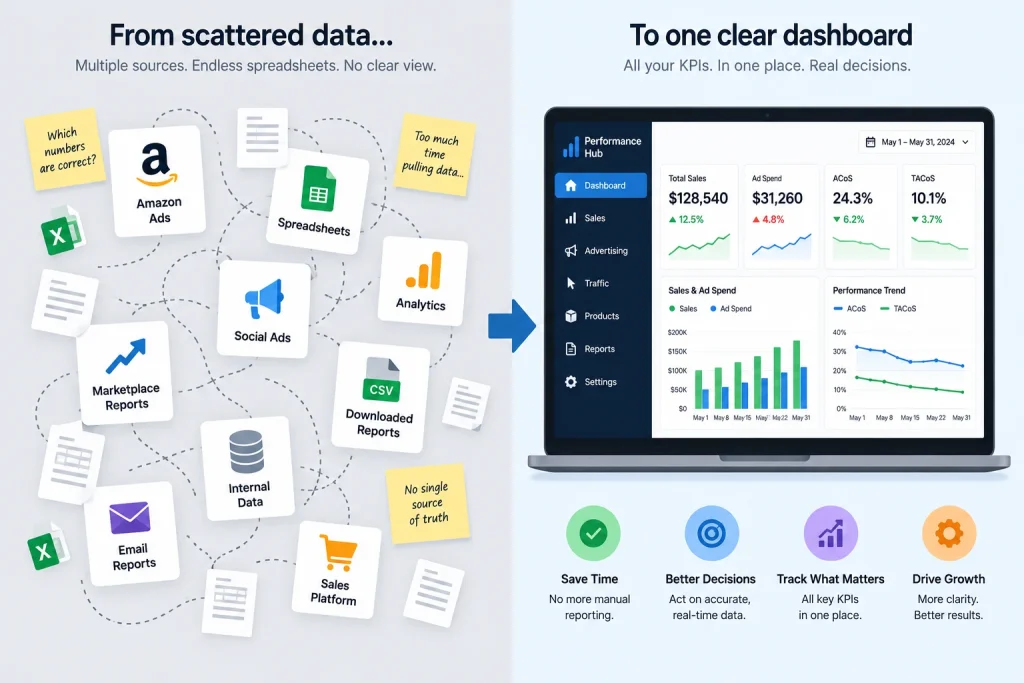
Case Study 1: Building a Dashboard That Actually Got Used
A client came to me with data scattered across four different tools and a habit of only checking numbers when something already felt wrong. I built them a single-page dashboard covering sales, ACoS, return rate, and stock levels, pulled together in a simple spreadsheet refreshed every Monday morning. Within a month, they caught a rising return rate on one product early enough to fix a sizing issue in the listing before it affected their account health metrics. The dashboard itself was not complicated, the value came entirely from it actually getting checked every week instead of sitting unused.
Case Study 2: Using KPI Targets to Fix a Stalled Product
Another client had a product with flat sales for several months and no clear idea why. I set specific weekly KPI targets for conversion rate and click-through rate, then reviewed them against category benchmarks. Their click through rate was healthy, but the conversion rate sat well below the typical range for their category, pointing to a listing problem rather than a traffic problem. We rewrote their bullet points and updated their main image, and the conversion rate improved within three weeks, translating directly into a meaningful sales increase without any additional ad spend.
Frequently Asked Questions About Amazon KPIs
Sales growth rate, conversion rate, return rate, order defect rate, buy box percentage, ACoS, and TACoS cover the core of most Amazon businesses. Which ones matter most depends on your business model, a private label seller weighs conversion rate and reviews heavily, while a reseller may focus more on buy box percentage and inventory turnover.
Start by grouping your KPIs into categories such as sales, advertising, customer experience, and inventory. Pull the underlying data from Seller Central’s Business Reports, Advertising reports, and Inventory Performance Dashboard, then bring it into one view, whether that is a simple spreadsheet or an automated tool like Sellerboard. I recommend starting simple and upgrading to automation once you have built the habit of checking it regularly.
A conversion rate around 10 to 15% for most categories, a return rate under 5%, an order defect rate under 1%, and a buy box percentage above 90% are reasonable starting benchmarks. These vary by category and product stage, so treat them as a starting point rather than a fixed rule.
ACoS, TACoS, click-through rate, and conversion rate on ad clicks are the core advertising KPIs I track for every client. ACoS and TACoS in particular are often confused, and understanding the difference between them matters more than tracking either one alone.
Review sales and advertising KPIs weekly, since they change quickly and problems compound fast if left unchecked. Review your full KPI list and targets quarterly to make sure they still match your current business goals rather than the goals you had a year ago.
Conclusion
Setting the right KPIs for your Amazon business in 2026 is not just smart. It is a must. These key performance indicators help you stay in control, track your success, and make fast changes. If you want to grow your store, improve your ads, manage your team, or scale your brand, you must use KPIs daily. Clear KPIs will help you stay strong in the fast-moving Amazon market. For help with setting and tracking powerful KPIs for your Amazon business, visit Amazon Consultant today.